Since ancient times the causes of severe infectious diseases in humans have been puzzling to people. Specifically, the recurrence of outbreaks, the severity of outcomes after infection ranging from permanent sequelae to premature death as well as the large impact in numbers in human populations have created the need to search for ways to learn about and prevent them. By continuous observations and through trial and error, civilizations were able to identify and distinguish the common features of certain infectious diseases and so to differentiate one from each other. Once fairly identified, people have been searching for effective and disease-specific ways to prevent them. It is in this search for prevention how vaccines appeared as tools against the nasty outcomes of infection. In this essay I will attempt a brief review of concepts related to how the immune system and vaccines work, and some key events in vaccine development.
Infectious diseases with severe outcomes in humans are several and new diseases continuously appearing. Yet, using the particular causes or the origins of infectious diseases, they can broadly be classified into four groups: bacterial, viral, parasitic and fungi. Among these causes, there are not yet vaccines against any parasite or fungus causing severe disease in humans. Among all those diseases caused by bacteria or viruses only a few of them have a vaccine to prevent humans from their burden. Even less, the available vaccines are only against a few strains, serotypes or serogroups of a given bacterium or virus. Therefore, the number of pathogens (bacteria and viruses) that could cause severe infectious diseases in humans is several times larger than the number of vaccines we have against them.
In general, bacterial and viral diseases are often grouped as pathogens causing diseases
Humans have been exposed to environments full of dangerous pathogens. These continuous exposure to pathogens caused outbreaks and diseases. The threat of infection requires response from human bodies and so the human body often reacts and fights the attacks of pathogens using an innate nonspecific immunity level, which is part of the immunity system. This is often called “primary response” which occurs following the first exposure to a foreign agent. If the response is quick and effective, the infection will be contained or eliminated. Sometimes, however, the response fails so infection would cause a disease. This could happen when the human body’s immunity is low and/or when the pathogen has a virulence to overcome the response, rapidly multiplying itself inside the human body and causing great damage to cells and tissues.
When humans were or are able to survive and recover from certain infectious diseases, their bodies generate some specific level of immunity to reinfections. It is because the human bodies have an immune system which is essential for our survival and where some specific memory about previous infections is stored and keeps the defense abreast. Specifically, that specific memory set in the immune system works as a first line of defense when potential reinfections with the same pathogens happen. Sometimes, such memory could wane in time and so make humans again susceptible to infection and disease; other times, exposure to the same pathogen would boost a decaying specific immunity and keep the protection against the attack of that pathogen high. Another important reason for humans becoming susceptible again is when the specific pathogen mutates and evolves, becoming unidentifiable and so making useless the previous specific memory of protection in our immune system.
Among all types of pathogens, the new or foreign ones of great concern are those that cause severe disease and often overwhelm the immune system by making their response slow and ineffective. Often are those that cause a heavy disease burden in the human population with plenty of sequelae or death. One way to prepare the immune system to such rapid and virulent attacks and to build a defense against them is with vaccines. Although there are different types of vaccines even against the same pathogen, in general all of them work like sparring for box or combat fighters; namely, as a sparring does, a vaccine safely and effectively stimulates the immune system, trains its rapid response and prepares it to fight. Effective vaccines are often able to mimic some or all specific characteristics – also known as antigens– of the pathogen. To keep the training of the immune system safe, these antigens in the vaccine are often weakened or killed versions of the real pathogen. In average, during the first two weeks after vaccination, the vaccine is able to prime the immune system to respond fast and with force, should an infection with the particular pathogen in full strength happen in the future. Some refer to this process as programming of the immune system and to the rapid and specific response as “secondary response” or “vaccine-induced response.” An effective secondary response is often faster and with force in the production of pathogen-specific antibodies and in creating more cellular memory in the immune system for future attacks. Yet, vaccine’s protection also could wane with time or the specific pathogen could mutate and evolve. Similar to natural immunity that could also wane, vaccine immunity could also wane or become useless against new versions of the pathogen making human bodies susceptible again to infection.
From the first vaccine developed in 1796 to the latest Covid19 vaccine, they are considered one of the greatest achievements of modern medicine. Throughout the last three centuries, several developments ranging from the advances in laboratory techniques, the discoveries in germ theory, the introduction of attenuated toxins, the cultivation of viruses, the evolution of cell culture to the introduction of recombinant DNA and the whole genome sequencing techniques have allowed the development of different vaccines and enjoy the progress and benefits we see today from them. In general, diseases that have caused the highest burden in morbidity and mortality in societies have received more attention and resources from those interested in developing vaccines.
Although vaccines have been an effective tool against infectious diseases, the development of each vaccine for a specific pathogen has often been a slow and research intensive process. Still, there were several attempts against some pathogens that did not end up with a safe and effective vaccine. Vaccine development follows a rigorous scientific process focused primarily on safety and then on its effectiveness. All these processes should have a sound foundation on basic biology research, scientific discovery of vaccine candidates as viable proof of concept. This is the point when the application of the investigation of a new vaccine should be submitted. After approval, a three-phase clinical studies and trial begins.
Roughly summarized, Phase I is focused on vaccine safety conducting trials in small groups of both animals and humans; phase II is focused on vaccine effectiveness trials in an increased number of humans. Phase III is one of the most important ones. In this phase, thousands of individuals are recruited and the sample distribution should be representative of the population where the vaccine will be targeted. Individuals are then randomly assigned to often two groups – this is referred to as random control trials or RCT. RCTs often have a control group not exposed to the vaccine (control) and a trial group that will be exposed to the vaccine (trial group). Except for the exposure to the candidate vaccine, it is expected that both groups have very similar demographics and clinical characteristics to avoid confounding factors. Then, both groups are followed and clinical and lab data collected. By comparing the rates of disease cases in the exposed group with those of the control group is how the vaccine safety and effectiveness are determined. If successfully safe and effective, the vaccine data is then submitted for analysis by independent institutions and then the vaccine is licensed and recommended.
In the recent past, the research and development of new vaccines used to take about 15 to 20 years. However, thanks to more than three decades of advances in DNA sequencing and the stable production of proteins in human cells exposed to messenger RNA (mRNA), the research and development time has been reduced substantially and made possible the development of Covid19 vaccines in less than a year. Had the Covid19 pandemic occurred 30 years ago, we would have been in worse shape to control or prevent their consequences.
Overall, human’s immune systems could rely on more effective and safe vaccines to prime their response against pathogens’ attacks. Yet, the burden of infectious diseases could only be partially reduced by vaccines. As mentioned above, among all those diseases caused by bacteria or viruses only a few of them have a vaccine to prevent humans from their burden and for those with a vaccine, the protection is often partial and may wane in time.
*Note: All the ideas developed in this essay were based on the references listed below.
This semester I took a course called Locomotion Neuromechanics. Like me, you might think that it would be a course where you would learn more about the movement within one’s body, different things that can affect mobility, etc. However, after attending the first class, I realized it was focused on the student’s own interest in a topic relating to Locomotion Neuromechanics. I found this method interesting because it allows the student to either dive deeper into their own research or explore other topics, related to locomotion, that they wouldn’t be able to in another class.
After the first round of presentations, the class had a broad range of topics that would be focused on like robotics, animal/insect locomotion, neurodegenerative diseases that impact mobility, flying snakes, spinal cord injuries, etc. At first, I had no idea on what topic I would be focusing on. I initially presented on something related to spinal cord injuries, but instead of focusing on humans, I was looking at animals like cats and mice. This changed after I was researching stuff that I would enjoy more. I then focused on the anterior cruciate ligament or commonly known as the ACL. This topic can go any way from what is the ACL, how it works, ACL injuries, etc.
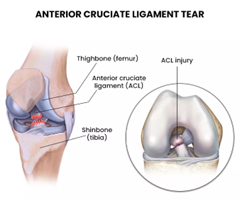
Before I start, you might be wondering what the ACL is. The ACL is a ligament that connects the femur to the tibia. The femur and tibia in layman’s terms are the thigh bone and shinbone, respectively, found in your leg. This ligament is important for knee and joint stability. You might wonder why your knee doesn’t move forward when you walk, jump, play sports, etc. The ACL is in charge of preventing the movement of the knee to go from the front to the back or side to side. It is most commonly known to have ACL injuries while playing sports such as soccer, football, basketball, gymnastics, etc.
Below are some of the interesting research facts that I found on my literature search about the ACL:
The two most common ACL reconstruction surgeries: bone patellar tendon bone graft and the hamstring graft
Hamstring strength recovered at a faster rate than quadricep strength (3)
Anterior knee pain influences the recovery of muscle performance of a patient after ACL reconstruction (3)
Younger patients had a higher rate of subsequent ACL injury rate, distinctly that young males had higher rate of rupture than females (6)
Researchers are trying to focus on rehabilitation programs that focus on the different forces that might heal an ACL (6)
Depending on some factors like the type of graft used, how the graft works post-operatively and the different fixation techniques (6)
In addition to rehabilitation programs, literature states that they are examining pre and post operative rehabilitation, neuromuscular training, electrostimulation and other protocols that an individual can go through after ACL reconstruction. (5)
A long term consequence of ACL reconstruction is osteoarthritis which is known to be a disease of the joints. Factors that can influence the outcome consists of sex, age, family history and muscle strength (4)
These were just a couple of interesting literature facts that my research came across focusing on ACL before and after reconstruction surgeries.
I am working on the final project for this class so if anyone is interested in other facts about the ACL or interested to learn more, let me know.
References:
Cavanaugh JT, Powers M. ACL Rehabilitation Progression: Where Are We Now? Curr Rev Musculoskelet Med. 2017 Sep;10(3):289-296. doi: 10.1007/s12178-017-9426-3. PMID: 28791612; PMCID: PMC5577427. https://pubmed.ncbi.nlm.nih.gov/28791612/
Kobayashi A, Higuchi H, Terauchi M, Kobayashi F, Kimura M, Takagishi K. Muscle performance after anterior cruciate ligament reconstruction. Int Orthop. 2004 Feb;28(1):48-51. doi: 10.1007/s00264-003-0502-5. Epub 2003 Aug 26. PMID: 12942198; PMCID: PMC3466568.https://doi.org/10.1007/s00264-003-0502-5
Lohmander, L. S., Englund, P. M., Dahl, L. L., & Roos, E. M. (2007). The long-term consequence of anterior cruciate ligament and meniscus injuries: osteoarthritis. The American journal of sports medicine, 35(10), 1756–1769. https://doi.org/10.1177/0363546507307396
Perry A, DeFroda S, Leporace G, Metsavaht L, Coxe CR, Bierman AM, Chahla J. ACL Rehabilitation: How Can We Lessen Injury Rates? Operative Techniques in Sports Medicine, 30,1, 2022. ISSN 1060-1872, https://doi.org/10.1016/j.otsm.2022.150892. https://www.sciencedirect.com/science/article/pii/S1060187222000041
Webster KE, Feller JA. Exploring the High Reinjury Rate in Younger Patients Undergoing Anterior Cruciate Ligament Reconstruction. Am J Sports Med. 2016 Nov;44(11):2827-2832. doi: 10.1177/0363546516651845. Epub 2016 Jul 7. PMID: 27390346. https://pubmed.ncbi.nlm.nih.gov/27390346/
As my previous article mentioned, this will be focused on what my role in The Devil Wears Science and what my group had accomplished for everything to run smoothly. I was in the group called Too Hot to Handle along with Sachit Swaminathan and Ashmitha Aravind.
Below showcases what was going on since October 2022. You would think that it was mostly researching about the science behind our piece of clothing, you aren’t wrong, but we also had to take into mind the time limit in presenting our findings in a fashion show, why was it important, etc.
Brainstorming:
We divided into groups, one for each professor
We started to through out ideas based off what everyone was involved in on campus or what they like to do (hobbies/clubs/organizations)
We came to an agreement to focus on bees
it was also due to that Dr. Leavey was our professor and she works with the bees
Dr. Leavey is the advisor of the beekeeping club so it was like we had a foot in the door before we started
She gave us ideas on what type of science to focus on:
heat exhaustion/heat stroke
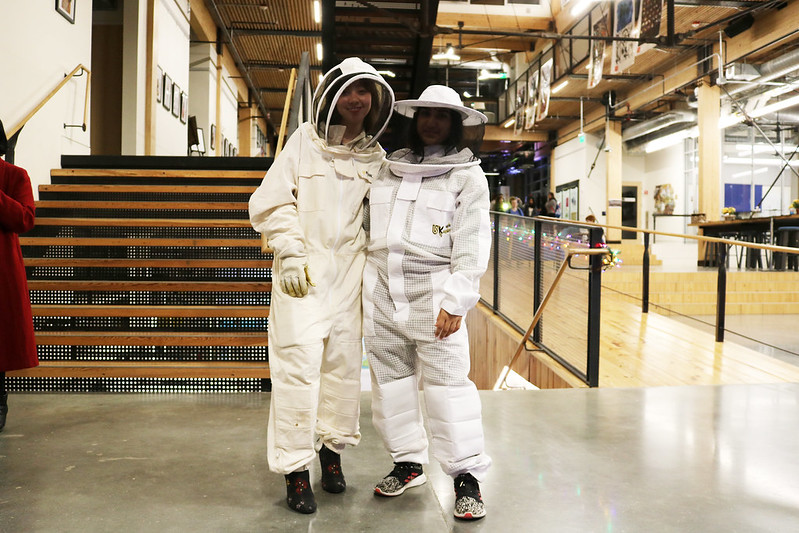
beekeepers suits pros/cons
real world examples
other professions that deal with this
GT related research work
Dividing work within our group:
We all decided to research information about heat exhaustion, heat stroke, the science behind both of these topics, examples in the real world and any experiment/research that GT might be involved in related to our topic
Some specific topics that we focused on: prevention, treatment, consequences, examples, researchers at topic
February – March:
Dividing into groups helped us obtain 5-6 different topics that we could discuss along with related clothing items.
We kept researching on our topics to focus on the main points, which eventually led to the writing of our script.
We had to keep our script within 5-6 minutes which allowed the model(s) to walk on the runway and for the audience to not get bored.
Deciding what we had to say and the time limit was harder than we thought. There was a lot of crucial information that we wanted to include but had to keep only the main points
March (me):
In addition to to the Too Hot to Handle research, I was asked to translate the Tagua nut group’s script to possibly present it in Spanish.
I received the script the week before and had time to translate it before our dress rehearsal.
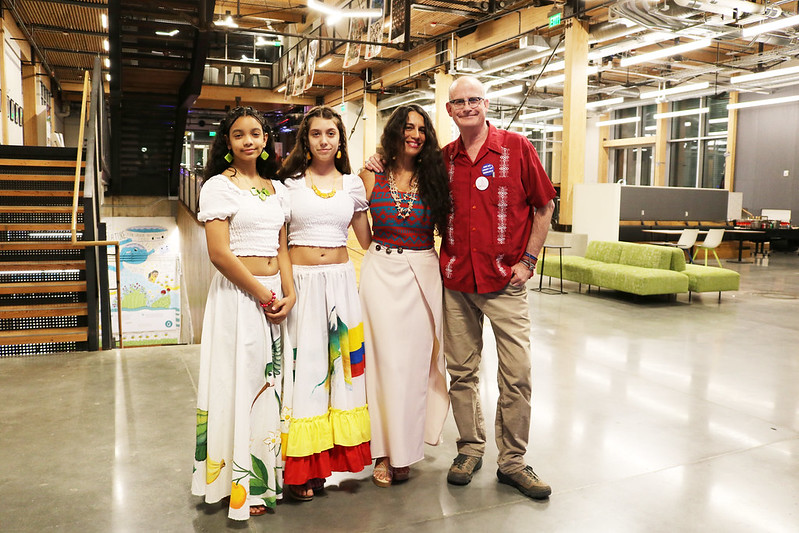
Dr. Mendelson and his friend that showcased in the Tagua Nut presentation
The Day Before:
We did a dress rehearsal in class to make sure each presentation was on time and that no group missed important information.
Me personally: I researched information about heat stroke/heat exhaustion and presented a script for my classmates to edit.
I translated the script, presented them with any feedback and ran it to see if it was within the time limit.
Day of event:
We got there 3 hours before show time to set up and make sure we didn’t forget anything.
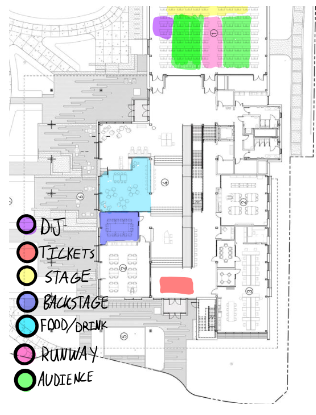
We set up the room, music (+ DJ came), the presentation/slides for timing and smoother transition
Other than minor microphone issues, each presentation ran smoothly and within the time limit
In addition to our fashion show, we let the audience have their own fashion show. I loved how our event was so interactive and hope everyone enjoyed it.
Whew! That was a rollercoaster of emotions. It has been a couple of weeks since our Atlanta Science Festival (ASF) event, The Devil Wears Science. We have been planning this fashion show since October 2022. All the hard work paid off and I couldn’t have done it without my classmates and professors.
This article will be focusing on the what was done leading up to the event (like a behind the scenes):
October: ASF idea brainstorming
We had to submit our proposal that had to include: title, teaser, price, audience, etc.
Event Description: During this event the audience will explore new scientific and technological innovations in fashion in the form of a fashion show. We will have presentations of fashion prototypes and ideas in science fields like textiles, chemistry, sustainability, engineering, and wearable devices. While presenters talk about the science and styles, models will show off these designs on the catwalk. At the end of the all the presentations, the audience will vote on their favorite designs. After the show, there will be a brief Q&A with the presenting scientists and fun networking opportunities. Audience members can participate by dressing up in their own scientific style for the opportunity to win small giveaway items like stickers, t-shirts, etc.
We adjusted our teaser to focus on the audience we wanted to bring
Teaser: Join Georgia Tech STEMComm in the fanciest and nerdiest fashion show of the year! See scientists, designers, and engineers showcase the newest innovations in fashion and wearable science on the runway. Vote on your favorite designs and strut in your own scientific style to win special event giveaways!
We vaguely outlined main deadlines up until the event date
November and December: Storyboard
Once we had our idea finalized and approved, we got started
We started to figure out main topics and clothing on what we should showcase (like clothing types)
We were also figuring out what campus organizations might be interested to collaborate or organization on/off campus. Some that we thought of are listed below:
The Hive
ID school
Beekeeper’s Club
Drama Tech
January:
With a new semester, we lost some members but we also gained new members.
We got back on track with planning the event
Created groups based on what everyone was interested in
We started dealing with advertising and marketing
We also finalized the event venue, event date/time
Kendeda Building
March 11, 2023 at 7pm
We also came to an agreement with what items of clothing we will be showcasing and what researchers would be included.
Beekeeper’s suit
3D printing on fabric
Tagua nut fashion
Wearables and Interactive Product Design Lab (Jim Budd)
We started outlining our presentation: what needs to be included, key points, science behind the clothing etc
February + Beginnings of March:
Finishing up our presentations on what we will be presenting at the event
Each group finalized their script to be within the time limit and to be able to include everything related to the item of clothing, the science behind it and anything else useful
Any last minute venue preparations and items that needed to be brought to the event (not sure who made this)
We reached out and kept in contact with our models
We kept up with the marketing and ticket sales
We then did a dress rehearsal the day before the event to make sure everything was within time, nothing left out, etc.
Be sure to tune into my next article where I’ll talk about what my group presented in the showcase and what my role was in the event. Also, what additional tasks we each had to do and help out our fellow classmates.
The use of a system of differential equations to model the epidemiological dynamics of diseases across human populations has lately gained prominence. Several scholarly articles with SIR-type models of different infectious diseases have been developed (Tang et al. 2020). This has come to light in great part due to the global epidemics of Covid19 since early 2020. References to models from different researchers and institutions have anxiously focused on predicting the waves of cases, hospitalizations, and deaths. Questions like how, for example, isolation and quarantine would affect the dynamics of the disease were analyzed. Beyond the fear and concerns of the pandemic, the rise in prominence of these models have also extended into the public’s discourse. Otherwise obscure technical terms like “flattening the curve,” “herd immunity,” “reproduction rate”, “Ro,” among others, have become common terms used by the tv hosts, journalists, and people often without the correct interpretation or with lack of basic comprehension.
Concept Box 1. SIR refers to an infectious disease epidemiological model that at each point of time estimates the number of people from a given population who could be either susceptible to, S(t), infected with, I(t) or recovered from, R(t), an infectious disease; ergo its name is read S, I, R. Moreover, each letter in SIR is a differential equation that changes with time, t, and so the three equations form a system of differential equations, ergo the SIR model or SIR-type model.
Yet, researchers, epidemiologists and public health officers have been using SIR-type models to guide health policies for quite some time (Luz et al. 2010; Chowel et al. 2016; Opatowski et al. 2018). Specifically, these models have already been used for the design and evaluation of control and prevention strategies in respiratory diseases (Scherer et al. 2002; Smith et al. 2010). However, little is known by the layman about how these models work, what their strengths and limitations are, how useful they are for disease surveillance and how effectively they measure the effectiveness of control and prevention strategies. Without diving into technical concepts and features, this article aims to provide a brief description of these models as well as their strengths and limitations in the investigation and control of respiratory diseases.
A typical SIR model
Many names for a model: Various terms have been used to name these models and could cause confusion about whether one is referring to the same or different one. Among these terms are “Dynamic models,” “Mathematical epidemiology models,” “Compartmentalized models, “Disease transmission models,” “Transition dynamic models,” “Group-structured epidemic models,” etc. In general, it could be said that these models are at the same time dynamic, mathematical, compartmentalized and describe disease transmission through rates of transitions among compartments (Chowell et al. 2016). Each one of these terms could well be used to describe these models.
However, the term that has gained more traction is SIR-type models for how the name describes the structure of the models. We will use this term along this article under the understanding that we are referring to the other terms as well.
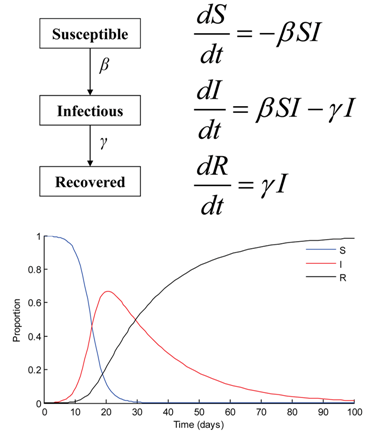
Structured SIR model: Among these models, the one with the simplest structure is the SIR model. Precisely, SIR stands for Susceptible, Infected and Recovered compartments (Figure 1). The names of these compartments are describing the health status of a fraction of a given population, when considering a specific infectious disease (Tang et al. 2020). Specifically, given an infectious disease, at a point of time a fraction of the population is susceptible, another fraction is infected and another one recovered, making the sum of the three compartments up to the total population size, N, namely, S + I + R = N. Namely, these compartments describe mutually exclusive groups of individuals.
Figure 1: Typical SIR model: the compartments, differential equations and progression of population disease states for susceptible, infected, and recovered compartments.
At an individual level, it could be said that the health status of a person is either susceptible, infected or recovered; namely a person’s health could not be in two compartments at the same time. Now, the transmission or the dynamics feature happens in intervals of time; namely, in an SIR model it is through time how parts of a population (or the probability that an individual) transitions from being susceptible to being infected and then to being recovered. In this example presented in Figure 1, the entire population becomes infected and eventually recovers.
Concept box 2. Each step along S, I or R disease status and transitions follows a specific rate in time: an infection rate that depends on the effective interaction between susceptible and infected individuals, , from susceptible to infection and a recovery rate, , from infected to recovered (Tang et al. 2020). A system of three differential equations with S, I and R as time-dependent variables and with transition rates as function parameters could be built along with initial conditions and balances.
Incrementally complex models
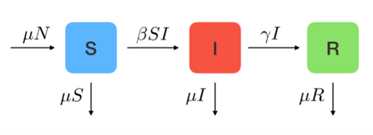
The model in Figure 1 is the simplest SIR model and helps only to illustrate the disease dynamics. Two additional components: the birth rate and the mortality rate provide more practical use. SIR models often assume a birth rate that increases the size of the population and usually it is an addition to the “Susceptible” compartment, meaning that all new births are susceptible to the specific infection disease. SIR model also distinguishes two types of mortality rates: one caused by factors other than the specific infectious diseases in the model, , and the second is the rate of death explicitly attributable to the infectious diseases being modeled, .
Figure 2: Typical SIR model with birth, non-disease and diseased-caused mortality rate. N stands for the total population, b for birth rate, , for all other causes mortality rate and , for infection-caused mortality rate.
However, adding mortality to SIR models is just one thin layer in the many other more complex configurations. SIR models become incrementally more complex in different ways depending on how the infectious disease behaves in the population. These variations are called SIR-type models. Among the many factors determining the model configuration, three are the most frequently observed: clinical course of the disease, demographic-driven modifications, and different disease risk conditions among groups in the population (Purkayastha et al. 2021).
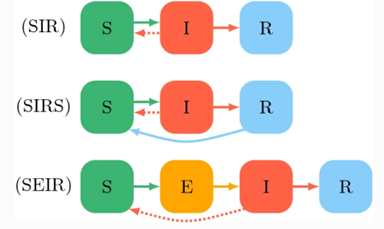
Figure 3: Incrementally complex SIR models with modifications due to waning of protection after recovered from infection (SIRS) or when a susceptible individuals become exposed as an intermediate stage before confirming infection (SEIR)
Among SIR configurations based on the clinical course of the disease is, for example, the SIRS models (Figure 3, mid-section). In general, this configuration is used to capture how the immunity gained by those who recover from infections wanes in time and, thus, makes them susceptible to reinfection (blue arrow from R to S). This clinical feature has also and often been observed in respiratory diseases when new variants of the pathogen causing the disease mutates significantly as in the annual influenza epidemics or as in the variant-driven waves in Covid19.
By the same token, a SEIR configuration (Figure 3, bottom) is used to model diseases like Covid19 when susceptible individuals are exposed to the pathogen causing the disease, but due to the clinical course of the infection (i.e., duration of the incubation period) or due to individual characteristics such as immunological conditions, may potentially result as infected or not. Also, when information about being exposed is known and individuals modify their behavior, i.e., self-isolation, until the infection diagnosis is confirmed or rejected.
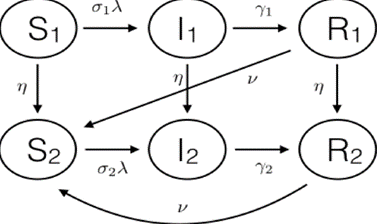
One of the most frequent demographic-driven modifications is the age-structured SIR model (Figure 4). The main reason for an age-structured SIR model is the differential behavior of infection (or course of the disease) and impact across age groups. This feature implies, among other characteristics, that different rates for each age group of either infection, recovery, or disease-caused mortality rates (or rates of other outcomes such as hospitalization) could be attributable to the same pathogen (Brand et al. 2020). Moreover, the interaction between different age groups could produce differences in the probability of transmission and infection. Facts like these have been observed in seasonal influenza as well as in Covid19 when the transmission and mortality seem to be different for different age groups. As shown in Figure 4, the SIR model includes two sets of S, I and R compartments, each subscript representing the specific population fraction of susceptible, infected and recovered of age group 1 and 2, respectively.
Figure 4: Basic age-and-disease state compartmental model with disease transitions, aging transitions and waning of immunity protection.
Concept Box 3. Two additional elements: First, is the transition probabilities or rates are specific to each age group and that aging is also represented by the transitions between compartments of susceptible as well as between infected and recovered across age groups. Second, similar to the SIRS model mentioned above, the figure also shows waning of immunity when those who recover from infection become susceptible again to reinfection.
Regarding modifications to the SIR model due to risk conditions among groups in the population, it is possible to have a structure similar to the described in Figure 4. Specifically, instead of age groups, there could be risk groups such as “high risk” for infection and severe outcomes (i.e., immunocompromised) versus non-high risks (i.e., immunocompetent) (Thomas et al 2020). Diseases like influenza and now Covid19 have shown different risks of severe outcomes given infection, like having comorbidities or immunocompromised conditions (Brand et al 2020). Figure 4 could also represent disease differences (i.e., different rates of incidence, prevalence) in the group of healthcare workers versus the general population (Thomas et al 2020).
It should be noted that the systems of differential equations representing the models described in Figures 2, 3 and 4 would incrementally be more complex than the system represented in Figure 1. Specifically, the structure of the three equations in Figure 1 would dramatically change (Chowel et al. 2016, Tang et al. 2020). Moreover, the number of differential equations will increase with the number of compartments modeled and the number of parameters such as the transition rates would also increase proportionally.
Reproductive number and Herd immunity
Perhaps the two most important epidemiology concepts in SIR models are the average reproductive number and the herd immunity threshold. The two concepts are specific to each disease and pathogen.
Concept Box 4. Herd immunity. This concept refers to the minimum percentage of people within a community who need to be immune to an infectious disease in order to reduce the size of the outbreak leading to its disappearance (Law et al. 2021; Royal Society 2020). Alternatively, it could be thought of as the minimum percentage of people needed to be immune to prevent an increasing outbreak. Immunity can occur from either a prior infection or from vaccination.
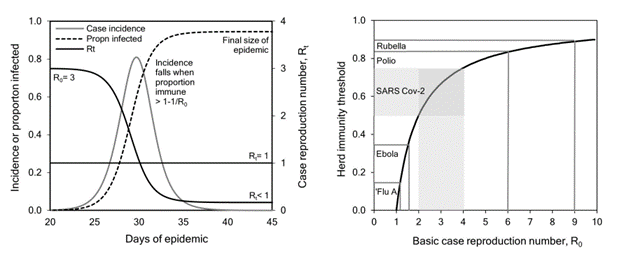
Figure 5a shows how the herd immunity is achieved when the proportion of those recovered levels out in time. While Figure 5b shows the relationship between herd immunity and reproductive number.
Figure 5: a) Build-up of herd immunity during a model epidemic of SARS CoV-2. b) Herd immunity threshold in relation to Ro, comparing SARS CoV-2 with influenza A, Ebola virus disease, Poliomyelitis and Rubella.
Concept Box 5. Basic reproductive number: The average reproductive number (Ro, pronounced R-nought) is the number of secondary infected cases caused by a single case during the course of the illness in a susceptible population. In simple words, how many new cases would appear for every single infected case is what Ro measures. In the first SIR model (Figure 1), Ro would be calculated as the ratio between β and γ. Naturally, in successive models the mathematical expression for Ro would have to be modified accordingly but would preserve the intuitive definition.
It is known, for example, that measles has a reproductive number of 14.5 (with Ro ranging from 13 to 16), which means that each case of measles could on average infect approximately 14 susceptible persons (Royal Society 2020). On the other hand, influenza and Covid19 have an Ro equal to 1.6 (range 1 to 3) and 2.6 (range 2 to 4), respectively. The key message here is that, when Ro < 1, the disease will eventually perish in the population, and if Ro > 1, the disease will keep spreading faster, the greater this number is.
Although not in a linear fashion, the basic reproductive number and the herd immunity threshold have an inverse relation between them; namely, when the percentage of people in a population immune to an infectious disease increases, the chance for secondary infections decreases substantially. This is seen by the following expression Herd Immunity = 1 + (1/Ro) x 100. In it, we see that the herd immunity threshold is inversely related to the basic reproductive number (Figure 5b). Specifically, when the force of infection substantially decreases down to a point where Ro < 1, (Figure 5a), the disease will perish in the population mainly because the percentage of people immune to the disease is high enough to provide protection to the rest of the remaining susceptible in the population, e.g., indirect protection, which is referred as “herd immunity.”
Using SIR models: control and prevention
Designing a SIR model is further from being just an academic or theoretical exercise. The dynamic features of SIR-type models have been used not only to elegantly describe the epidemiological progression of an infectious disease outbreak in a population, but also to predict its future health burden and progression (Tolles et al. 2020, Xu et al. 2021). They have been used to design practical and effective strategies that reduce the disease burden. Specifically, a SIR model, when properly designed, would be able to measure and predict the health impact of the infectious disease in absence of an intervention (i.e., the model could estimate the number of disease cases, associated hospitalization or deaths) as well as measuring the potential impact of disease control and prevention strategies. In other words, the effectiveness of an intervention would be assessed by the relative or proportional reduction in the disease impact compared to the absence of intervention (i.e., relative or proportional reduction in disease cases, associated hospitalizations or deaths).
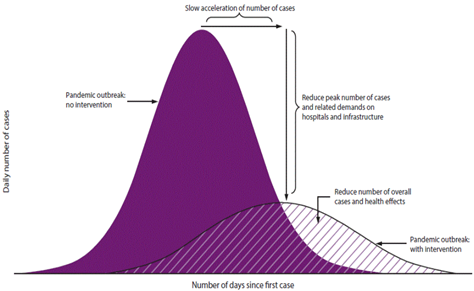
Concept box 6. Flattening the curve: At the beginning of the Covid19 pandemic and for months, the “flattening the curve” expression was often heard, mostly as a question, “how to flatten the curve?” Any strategy addressed to control or prevent a disease outbreak or a large epidemic such as the Covid19 could be considered a “flattening the curve” strategy (Figure 6); namely, strategies that leads to the deceleration in the number of cases causing a reduction in their daily and overall numbers during the pandemic (Specktor 2020).
Figure 6: Flattening the curve refers to those strategies that decrease the effective contact rate, β, that also decreases Ro, delaying and lowering the peak of daily infection rate that occurs in an epidemic. The figure measures the epidemic curve of the daily number of cases, but it could also measure hospitalizations or deaths.
During a large outbreak that overwhelms the healthcare system in a given population, flattening the curve below the healthcare system capacity would prevent its collapse. This becomes crucial when the number of hospital beds, respiratory devices or other resources are limited and when there are no prophylactic methods available such as vaccines, antivirals or antibacterials that could be used to prevent the infections among susceptibles or cure the disease among infected. In the early months of the Covid19 pandemic, social distancing of susceptibles along with wearing masks and hand washing were promoted to reduce the daily number of cases. When exposures happened and infection was suspected, isolation and quarantine were also recommended (Xu et al. 2021). All these non-pharmaceutical-based recommendations sought to decrease and maintain low social interactions within the communities and, by doing so, reduce disease transmission, seeking a low β, which eventually would decrease Ro (Figure 6).
Social distancing: In general, keeping the daily number of disease cases at a manageable level for healthcare providers to be able to provide medical services was desired to be sustainable in time. However, we have seen how healthcare capacity in some places and times was overwhelmed by the high level of new daily cases. In SIR models, social distancing has been introduced following different approaches and could help to visualize where these increases in healthcare demand would happen.
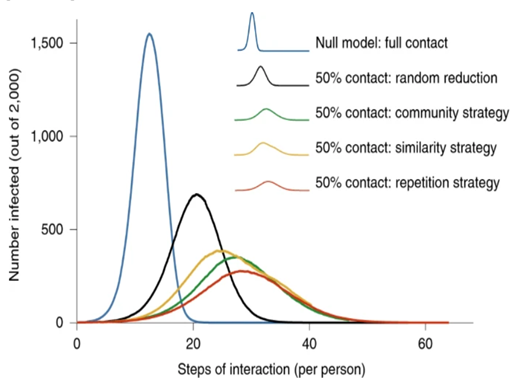
In SIR models, the effectiveness of “flattening the curve” of different contact reduction strategies could have a different impact when compared to no social distancing, i.e., full contact (Figure 7). As we can observe, it is not only the reduction in the frequency of contacts (i.e. 50% reduction in contacts), but also whether the contact is random with any member in the community or repetitive with a selective group in the population (Block et al. 2020). Each type of interaction could significantly affect the shape, size and peak of the flattened curve.
Figure 7: The effectiveness of “flattening the curve” of four different contact reduction strategies when compared to no social distancing (i.e., full contact). Two determinant factors are the reduction in the frequency of contacts and how the contact takes place.
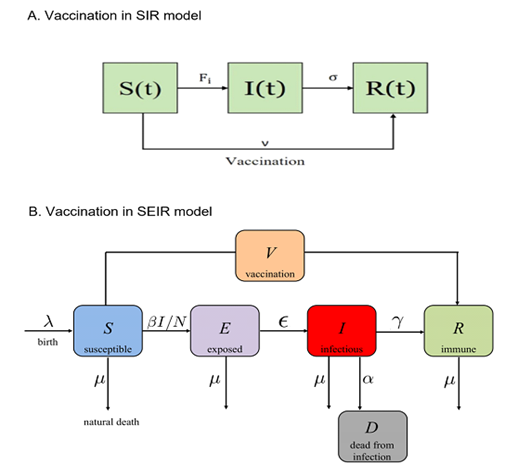
Concept Box 7. Vaccination in SIR models: When available, the most effective strategy to prevent large epidemics of infectious diseases is the use of vaccines. However, vaccines for new and emergent diseases that cause large outbreaks are often unavailable at the beginning of the epidemics. SIR models of infectious diseases can include vaccination strategies and then be able to predict the effectiveness impact of vaccination programs (Scherer et al 2002).
Figures 8a and 8b show the impact of vaccination by either including a rate of vaccination from susceptible individuals to recovered (the SIR model with vaccination rate v, Figure 8a) or by including a new compartment, vaccinated individuals, V, which is different that those recovered (Figure 8b). In both cases, susceptible avoid being infected by being vaccinated.
Figure 8: Modeling vaccination strategies in SIR-type models: (a) in classical SIR model and (b) in SEIR model as in Covid19.
Take-away message
A SIR model as any mathematical model is a simplification of how the infectious disease behaves in the population. It is suppose to capture the essential elements of a natural phenomenon: the dynamics of an infectious disease in the population. When well designed and calibrated, it could be a reliable tool, a working hypothesis that helps in the prediction, control and management of the disease impact. However, SIR-type models depend on their assumptions and on the data fed to the model (Adamu et al. 2019). The assumptions are usually educated guesses about many key clinical, epidemiological, and demographic components in the model for which robust data are not available. The assumptions are made to solve part of the uncertainty about such components. Assumptions, for example, about how transmission happens in the community versus in healthcare settings or close environments, our assumptions about how a new treatment works or how long the vaccine protection lasts would change the outcomes of the model. When high quality data are available, the model would depend less on assumptions and more on evidence provided by the data (Tang et al. 2020).
It should be noted that if there were enough high-quality data for all key epidemiological components, one could just statistically analyze these data to then guide recommendations (Xu et al. 2021). That would make SIR models less necessary or even irrelevant. However, perfect information is seldom the case in sudden large epidemics of new diseases and so, SIR modeling helps to integrate the scarce data available with well-educated assumptions about those areas where uncertainty remains. In this context, the SIR models could be seen as a state of knowledge in between two learning scenarios: the complete uncertainty where everything is ignored and the full availability of data about the disease in the population (Tolles et al. 2020). In that sense, SIR modeling uses what is known and what is assumed about the disease and its burden to calibrate the model parameters and then see if the dynamics of the model replicates the reality of the disease. Various statistical, numerical and approximation approaches could be used to calibrate the SIR models.
Additionally, one could suspect that there is a minimum of data needed to design a useful SIR model. Among them disease-, country- and region- specific epidemiological data would be required. Also, disease-specific clinical data regarding the outcomes of infections; namely, proportion of infected people fully recovered, recovered with temporary or permanent sequelae or portions of infected who die (Chowell et al. 2016). Along these lines, the specific effectiveness of available treatments, of control strategies like wearing masks, washing hands, or social distancing would also be helpful. Population data such as size of risk groups or age groups would be important when the disease impact is different depending on the risk, age or comorbidity conditions of some groups in the population (Brand et al. 2020).
Overall, SIR-type models of infectious diseases have become important tools. Researchers, biologists, epidemiologists, and public health officers who are focused on predicting, controlling and preventing the impact of large outbreaks or epidemics caused by emerging infectious diseases resort to these models. This article aimed to introduce in no-technical terms the main characteristics and virtues of these models. I do understand that these notes are quite incomplete and only cover a few topics among many related others without going into the complexities. However, the aim is to provide an informal introduction to these models and how useful they could be when dealing with population health events in the future
References:
Adamu HA, Muhammad M, Jingi AM, Usman MA. Mathematical modeling using improved SIR model with more realistic assumptions. International Journal of Engineering and Applied Sciences (IJEAS). 2019. 6. 10.31873/IJEAS.6.1.22.
Block P, Hoffman M, Raabe IJ. et al. Social network-based distancing strategies to flatten the COVID-19 curve in a post-lockdown world. Nat Hum Behav 4, 588–596 (2020). https://doi.org/10.1038/s41562-020-0898-6
Brand SP, Munywoki P, Walumbe D, Keeling MJ, Nokes DJ. Reducing respiratory syncytial virus (RSV) hospitalization in a lower-income country by vaccinating mothers-to-be and their households. Elife. 2020 Mar 27;9:e47003. doi: 10.7554/eLife.47003. PMID: 32216871; PMCID: PMC7556875
Chowell G, Sattenspiel L, Bansal S, Viboud C. Mathematical models to characterize early epidemic growth: A review. Phys Life Rev. 2016;18:66-97. doi:10.1016/j.plrev.2016.07.005 https://www.ncbi.nlm.nih.gov/pmc/articles/PMC5348083/
Law KB, M Peariasamy K, Mohd Ibrahim H, Abdullah NH. Modelling infectious diseases with herd immunity in a randomly mixed population. Sci Rep. 2021;11(1):20574. Published 2021 Oct 18. doi:10.1038/s41598-021-00013-2 https://www.ncbi.nlm.nih.gov/pmc/articles/PMC8523531/
Luz PM, Struchiner CJ, Galvani AP. Modeling transmission dynamics and control of vector-borne neglected tropical diseases. PLoS neglected tropical diseases, 2010 4(10), e761. https://doi.org/10.1371/journal.pntd.0000761
Opatowski L, Baguelin M, Eggo RM. Influenza interaction with cocirculating pathogens and its impact on surveillance, pathogenesis, and epidemic profile: A key role for mathematical modeling. PLoS Pathog. 2018;14(2):e1006770. Published 2018 Feb 15. doi:10.1371/journal.ppat.1006770 https://www.ncbi.nlm.nih.gov/pmc/articles/PMC5814058/
Purkayastha S, Bhattacharyya R, Bhaduri R. et al. A comparison of five epidemiological models for transmission of SARS-CoV-2 in India. BMC Infect Dis 21, 533 (2021). https://doi.org/10.1186/s12879-021-06077-9
Scherer A, McLean A. Mathematical models of vaccination, British Medical Bulletin, Volume 62, Issue 1, July 2002, Pages 187–199, https://doi.org/10.1093/bmb/62.1.187
Smith AM, Ribeiro RM.Modeling the viral dynamics of influenza A virus infection. Crit Rev Immunol. 2010;30(3):291-8. doi: 10.1615/critrevimmunol.v30.i3.60. PMID: 20370636 https://www.dl.begellhouse.com/journals/2ff21abf44b19838,1629d2c3507c27c5,5aa3a295481caaac.html
Specktor, B. (2020, March 16). Coronavirus: What is ‘flattening the curve,’ and will it work? LiveScience. Retrieved April 18, 2022, from https://www.livescience.com/coronavirus-flatten-the-curve.html
Tang L, Zhou Y, Wang L, Purkayastha S, et al. A Review of Multi-Compartment Infectious Disease Models. International Statistical Review, Volume88, Issue2. August 2020. Pages 462-513 https://onlinelibrary.wiley.com/doi/10.1111/insr.12402
The Royal Society. Herd immunity in the epidemiology and control of COVID-19. SET-C-Rapid Review, November 26, 2020. Available at https://royalsociety.org/-/media/policy/projects/set-c/set-c-herd-immunity.pdf
Thomas DM, Rodney S, Nikhil V D; Swati D, Nicholas C. A Primer on COVID-19 Mathematical Models. Obesity Vol. 28, Iss. 8, (Aug 2020): 1375-1377
Tolles J, Luong T. Modeling Epidemics With Compartmental Models. JAMA. 2020; 323(24):2515–2516. doi:10.1001/jama.2020.8420
Xu Z, Wu B, Topcu U. Control strategies for COVID-19 epidemic with vaccination, shield immunity and quarantine: A metric temporal logic approach. PLoS One. 2021 Mar 5;16(3):e0247660. doi: 10.1371/journal.pone.0247660. PMID: 33667241; PMCID: PMC7935317. https://journals.plos.org/plosone/article?id=10.1371/journal.pone.0247660
Specific references from where Figures 1 to 8 were borrowed for this article
For Figure 1.
Luz PM, Struchiner CJ, Galvani AP. Modeling transmission dynamics and control of vector-borne neglected tropical diseases. PLoS neglected tropical diseases, 2010 4(10), e761. https://doi.org/10.1371/journal.pntd.0000761
For Figure 2.
Sasaki, K. (2020, March 11). Covid-19 dynamics with sir model. The First Cry of Atom. Retrieved April 20, 2022, from https://www.lewuathe.com/covid-19-dynamics-with-sir-model.html
For Figure 3:
Dias S, Queiroz K, Araujo A. Introduction to Group-Structured-Epidemic Model. J Control Autom Electr Syst 33, 23–37 (2022). https://doi.org/10.1007/s40313-021-00841-7 https://link.springer.com/article/10.1007/s40313-021-00841-7
For Figure 4:
Brand SP, Munywoki P, Walumbe D, Keeling MJ, Nokes DJ. Reducing respiratory syncytial virus (RSV) hospitalization in a lower-income country by vaccinating mothers-to-be and their households. Elife. 2020 Mar 27;9:e47003. doi: 10.7554/eLife.47003. PMID: 32216871; PMCID: PMC7556875
For Figure 5:
The Royal Society. Herd immunity in the epidemiology and control of COVID-19. SET-C-Rapid Review, November 26, 2020. Available at https://royalsociety.org/-/media/policy/projects/set-c/set-c-herd-immunity.pdf
For Figure 6:
Specktor, B. (2020, March 16). Coronavirus: What is ‘flattening the curve,’ and will it work? LiveScience. Retrieved April 18, 2022, from https://www.livescience.com/coronavirus-flatten-the-curve.html
For Figure 7:
Block P, Hoffman M, Raabe IJ. et al. Social network-based distancing strategies to flatten the COVID-19 curve in a post-lockdown world. Nat Hum Behav 4, 588–596 (2020). https://doi.org/10.1038/s41562-020-0898-6
For Figure 8: (two references)
Law, K.B., M. Peariasamy, K., Mohd Ibrahim, H. et al. Modeling infectious diseases with herd immunity in a randomly mixed population. Sci Rep 11, 20574 (2021). https://doi.org/10.1038/s41598-021-00013-2
Xu Z, Wu B, Topcu U. Control strategies for COVID-19 epidemic with vaccination, shield immunity and quarantine: A metric temporal logic approach. PLoS One. 2021 Mar 5;16(3):e0247660. doi: 10.1371/journal.pone.0247660. PMID: 33667241; PMCID: PMC7935317. https://journals.plos.org/plosone/article?id=10.1371/journal.pone.0247660
Traveling through the aerial space is how I moved across the city during my visit to La Paz, Bolivia, last summer. No, I do not have wings or flying powers. I did not rent a helicopter or any kind or aircraft either. What I did was along with what hundreds of thousands of local citizens do every day: take rides in aerial lifts, also known as gondola lifts or cable cars. Every ride in the cabins of Mi Teleferico has been an amazing experience. Have you ever been to a ski/snowboarding resort and taken a lift or have riden a cable car at Six Flags Over Georgia? I confess that at Six Flags Over Georgia was my first time ever riding the Skyride or so-called gondola lift. This might have not crossed your mind, but that experience magnified what happened to me this past summer in La Paz.
Since the early twenty century, modern cities have adopted different types of massive public transportations such as on the ground trains or underground subway trains. In general, these transportation systems are optimal for cities on relatively flat surfaces. Sometimes, lines of ferry boats are implemented when navigable bodies of water such as rivers or lakes could be used around cities. However, La Paz’s geography is quite different. La Paz is a hilly city built in a valley like a bowl with streets and avenues climbing steep hills and without navigable bodies of water. Therefore, in La Paz, a network of cable car lines has been considered the best option. MiTeleferico, the transportation authority, manages the network of cable cars which has been implemented as a system of mass transportation since about a decade ago.
All relate back to Mi Teleférico in La Paz, Bolivia, which is also a home city deep into the heritage of my parents and family and by extension deep into mine as well. This past summer I had the opportunity once again to travel to Bolivia and visit my extended family. Bolivia is located in South America and is one of the two countries, along with Paraguay, that is landlocked. Bolivia has many interesting attractions both for native people and tourists.
Some include:
Salar de Uyuni: the largest salt deposit in the world (Pic.1)
Pic 1: Salar de Uyuni excursion in 2016
Lake Titicaca: highest navigable body of water in the world (Pic. 2)
Pic 2: Lago Titicaca in Copacabana
A country with the highest capital: La Paz’s altitude is ~3,600 meters (~12,000 feet) above sea level
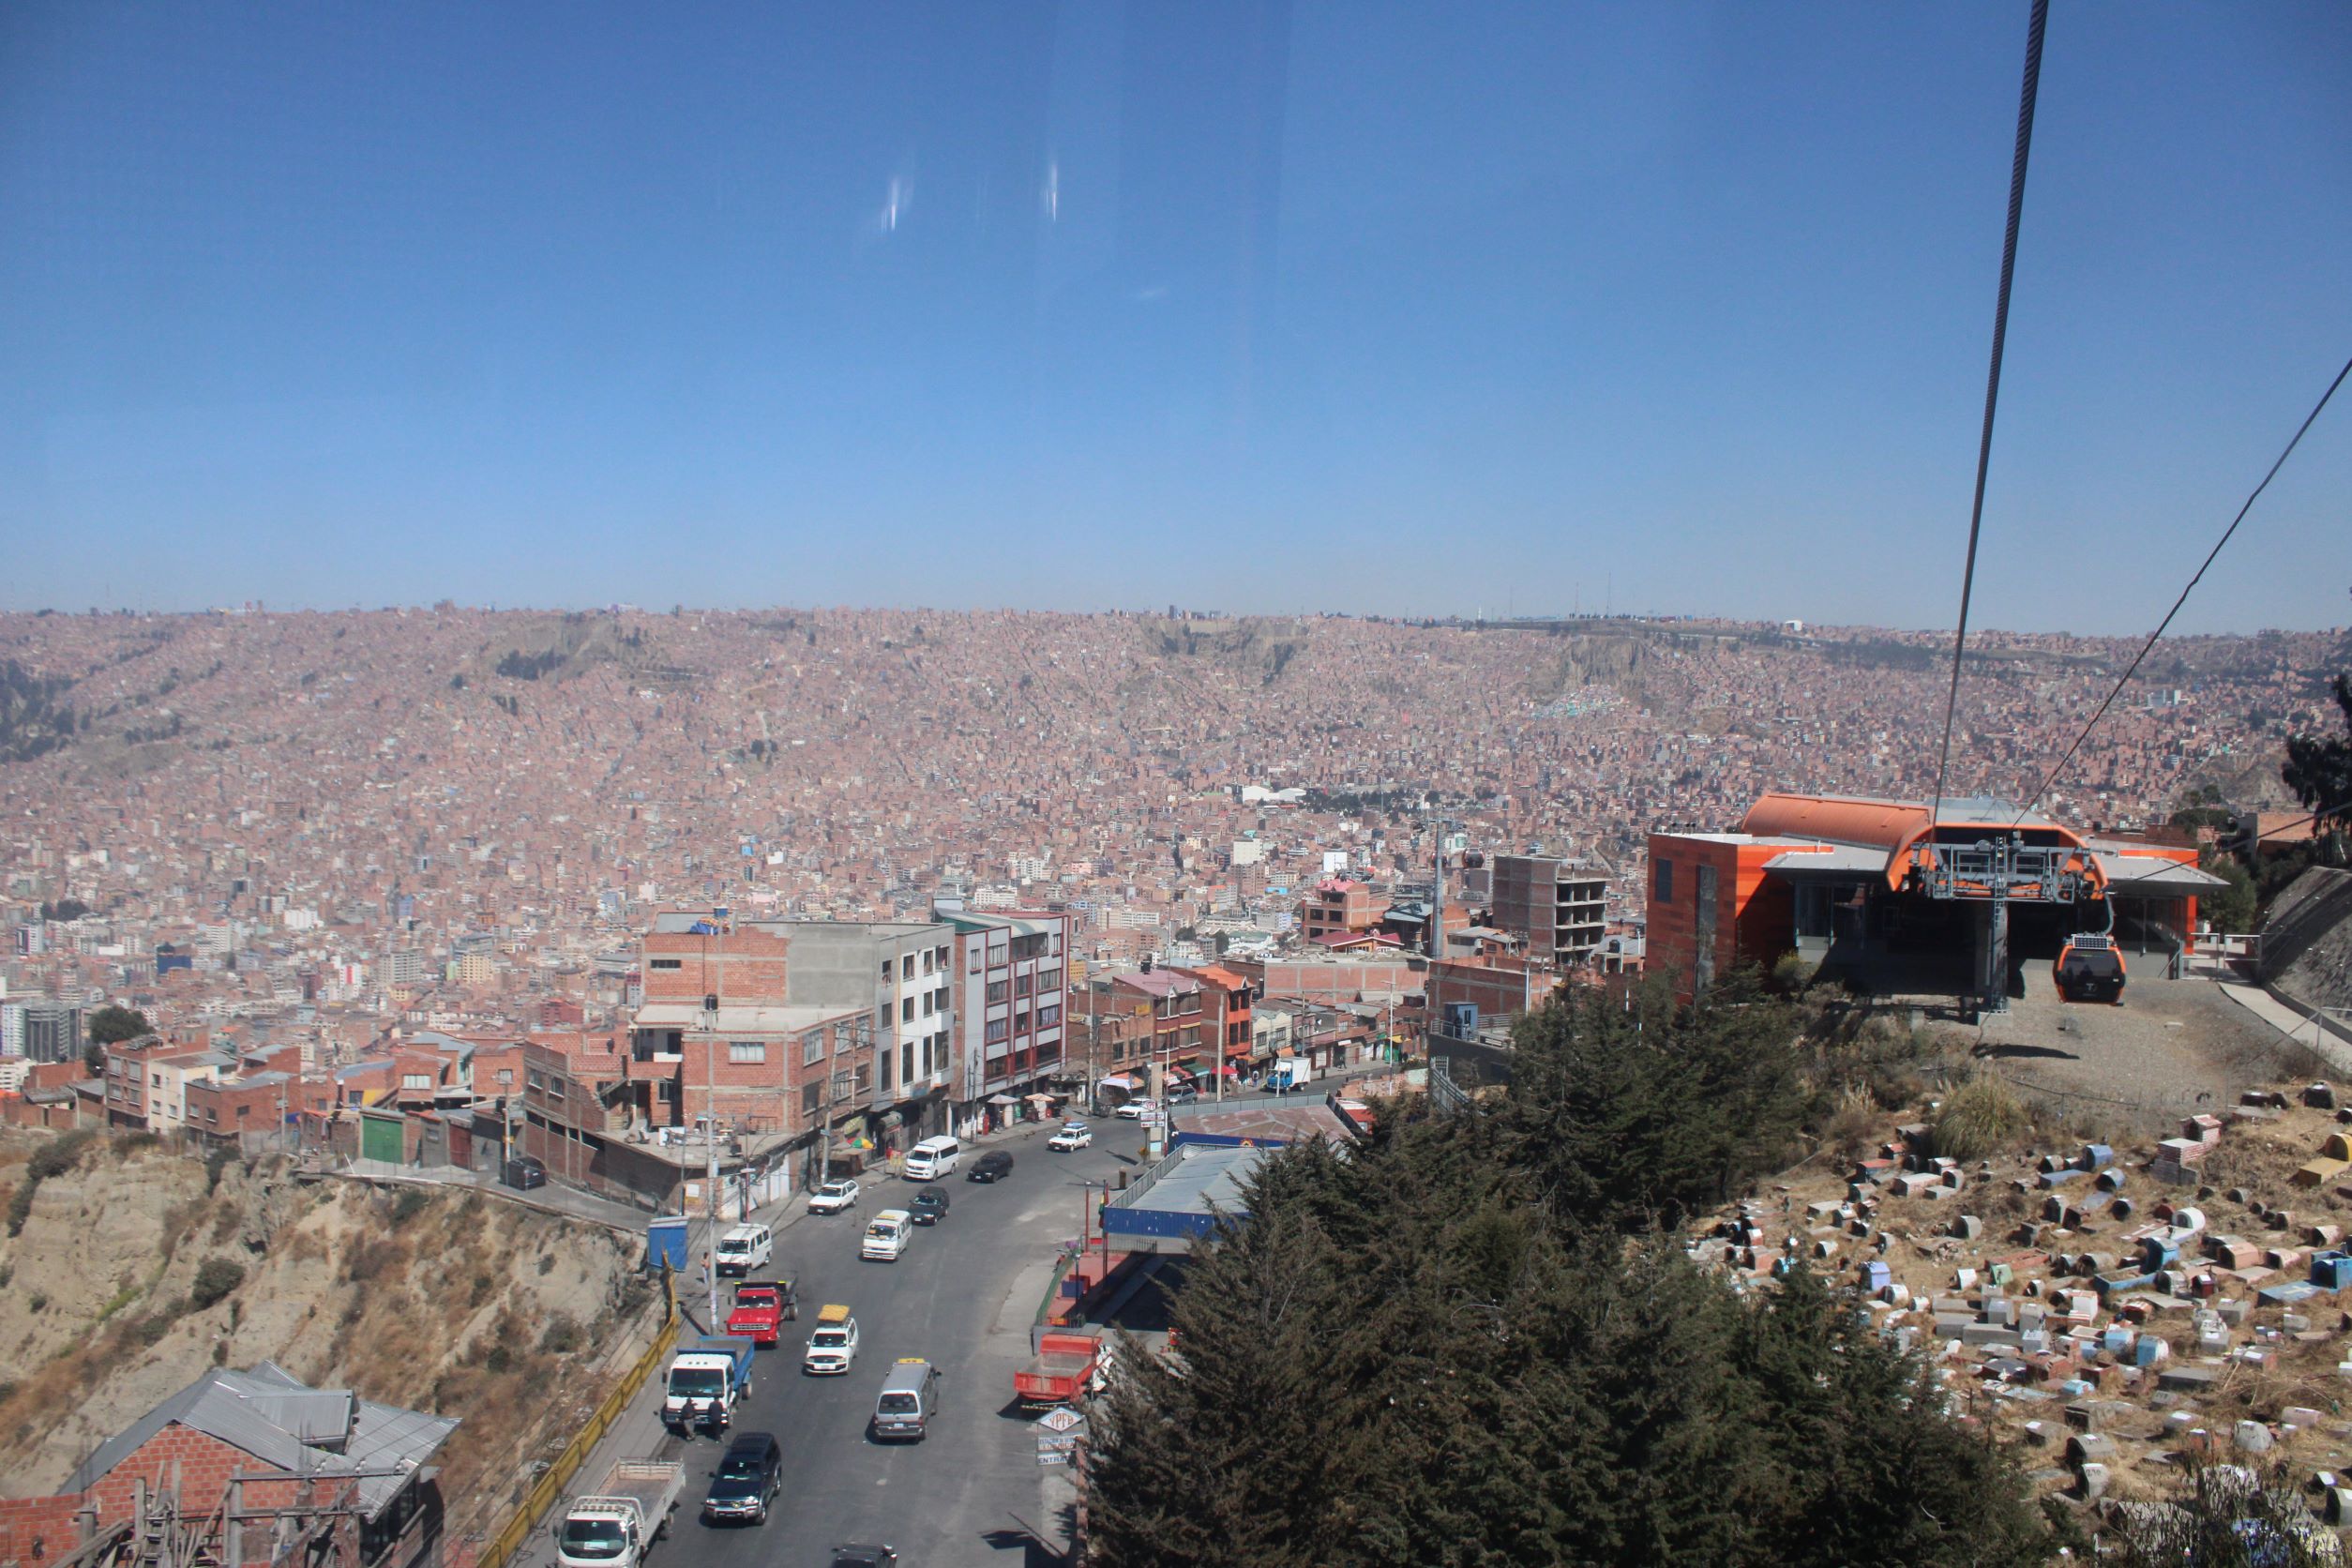
Mi Teleferico: longest and highest urban cable car network (Pics 3-10)
Pic 3: On the Orange line feat. IllimaniPic 4: View of the city from the Orange line
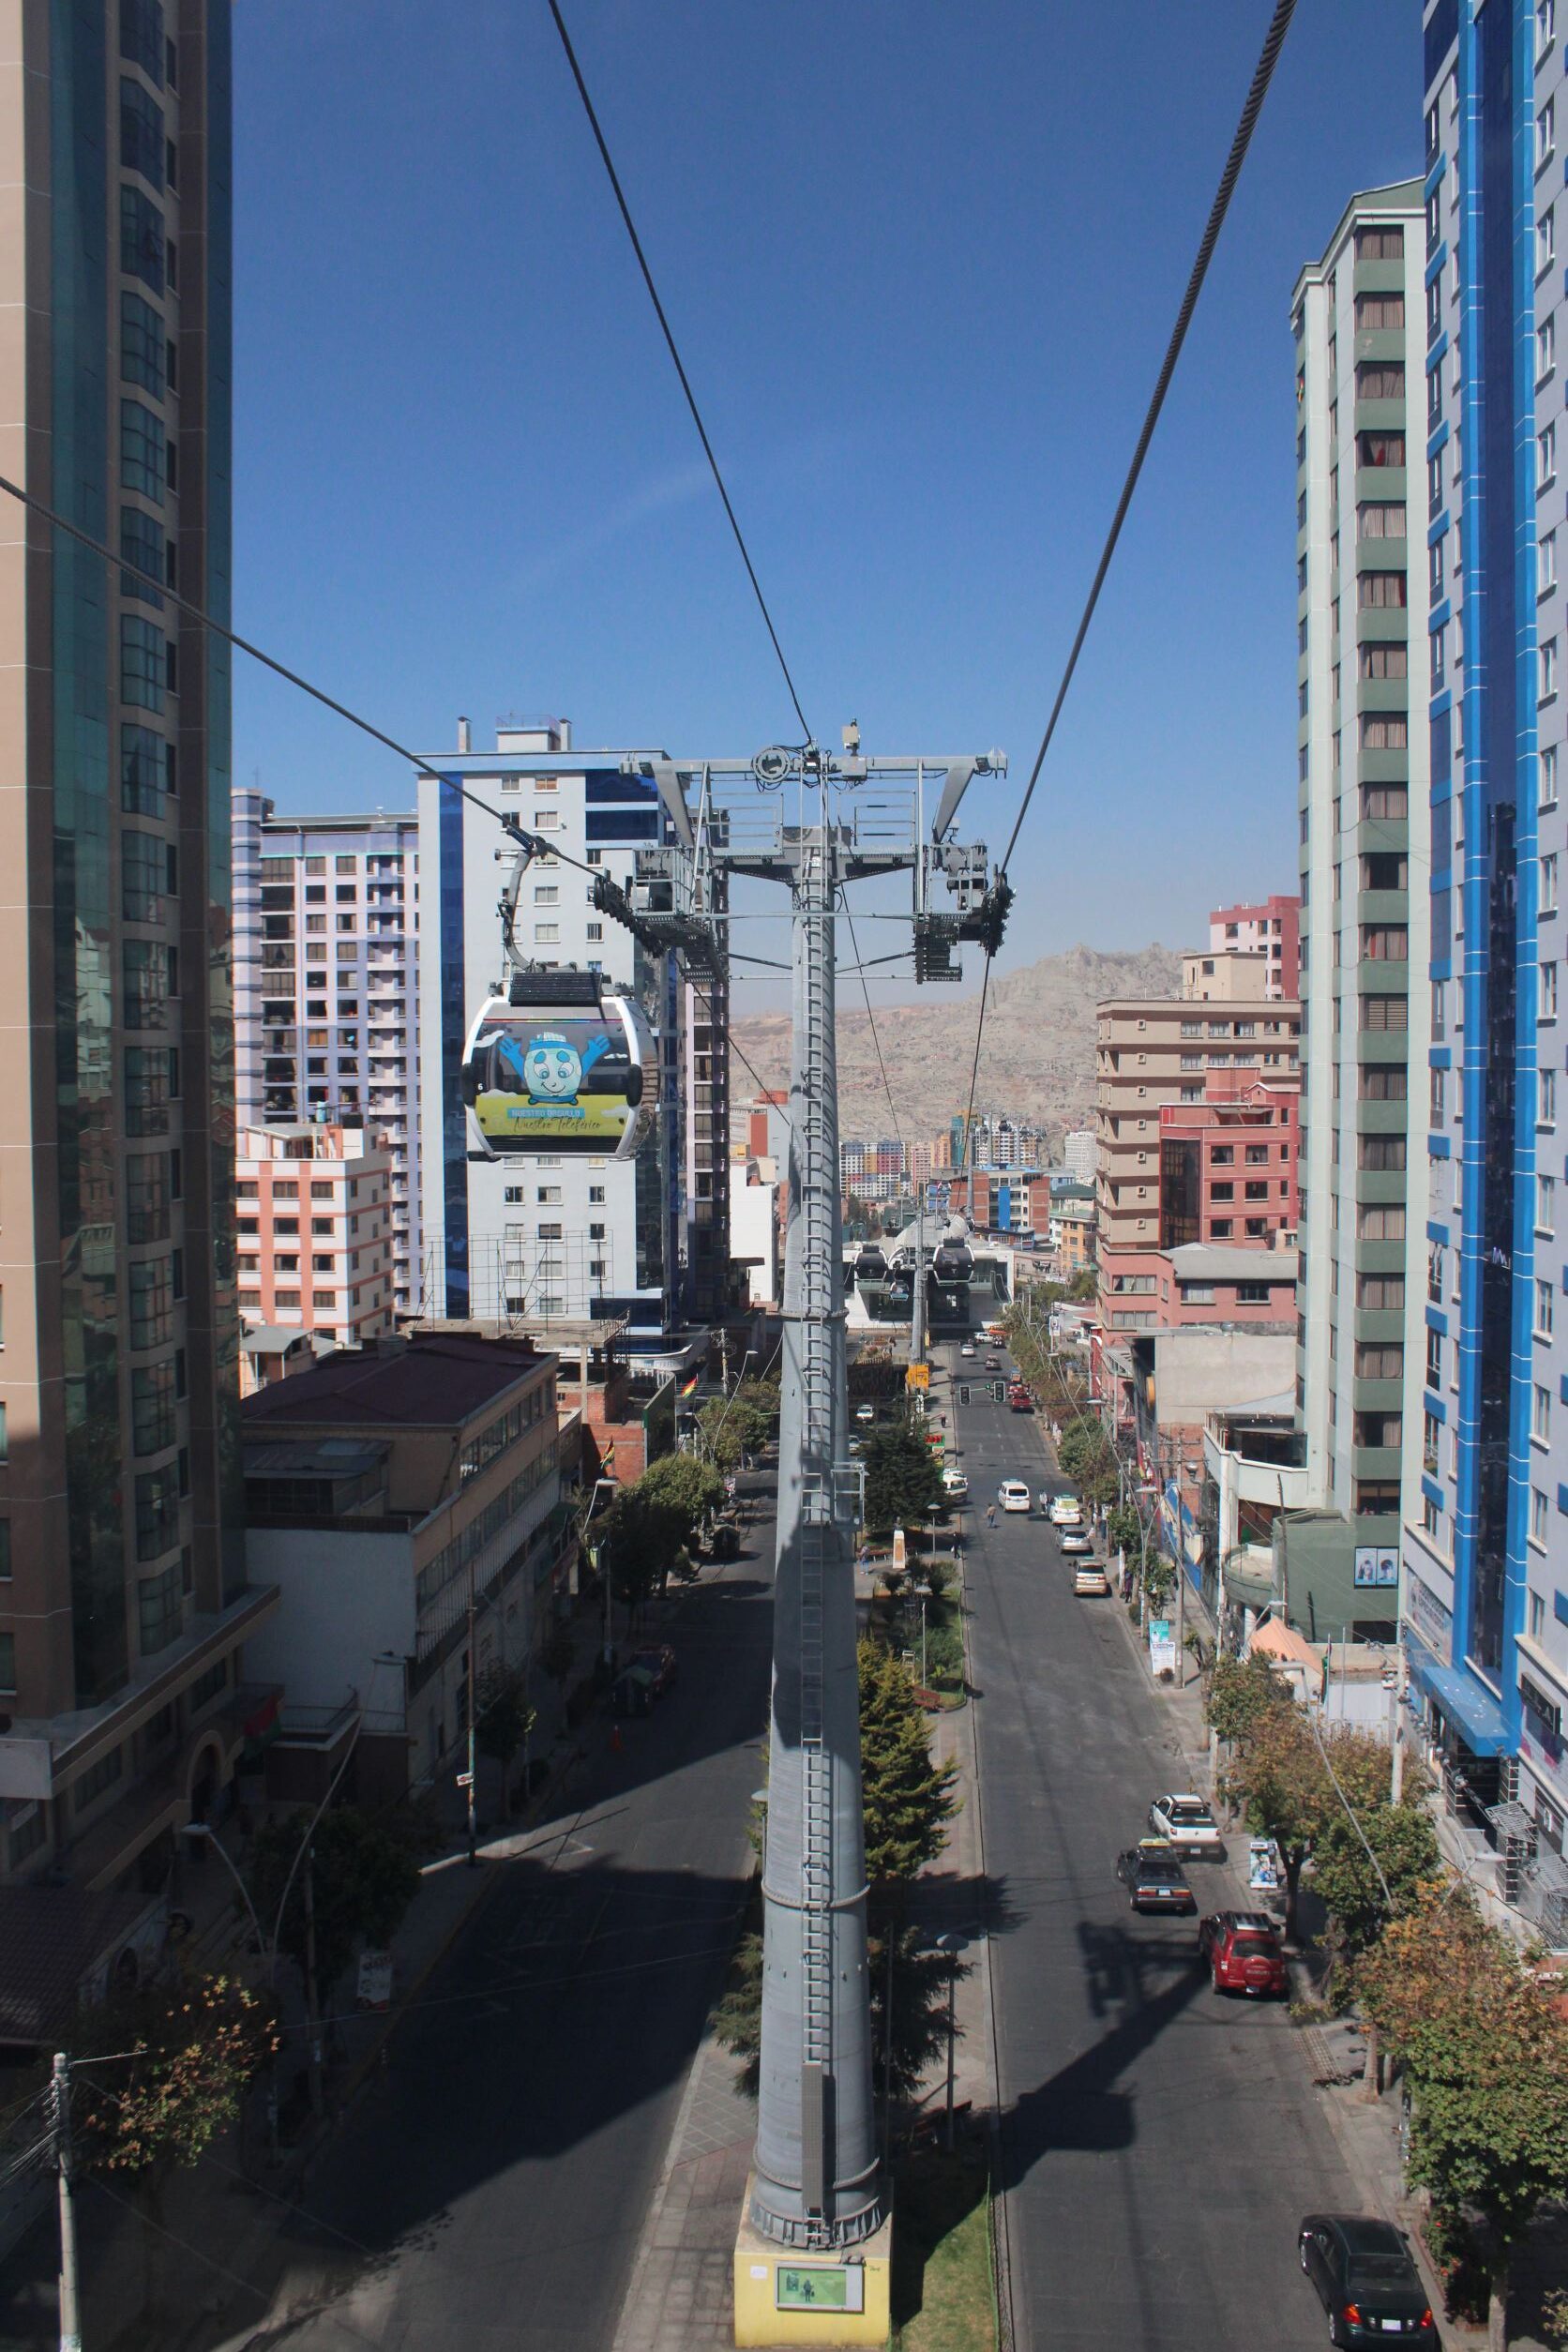
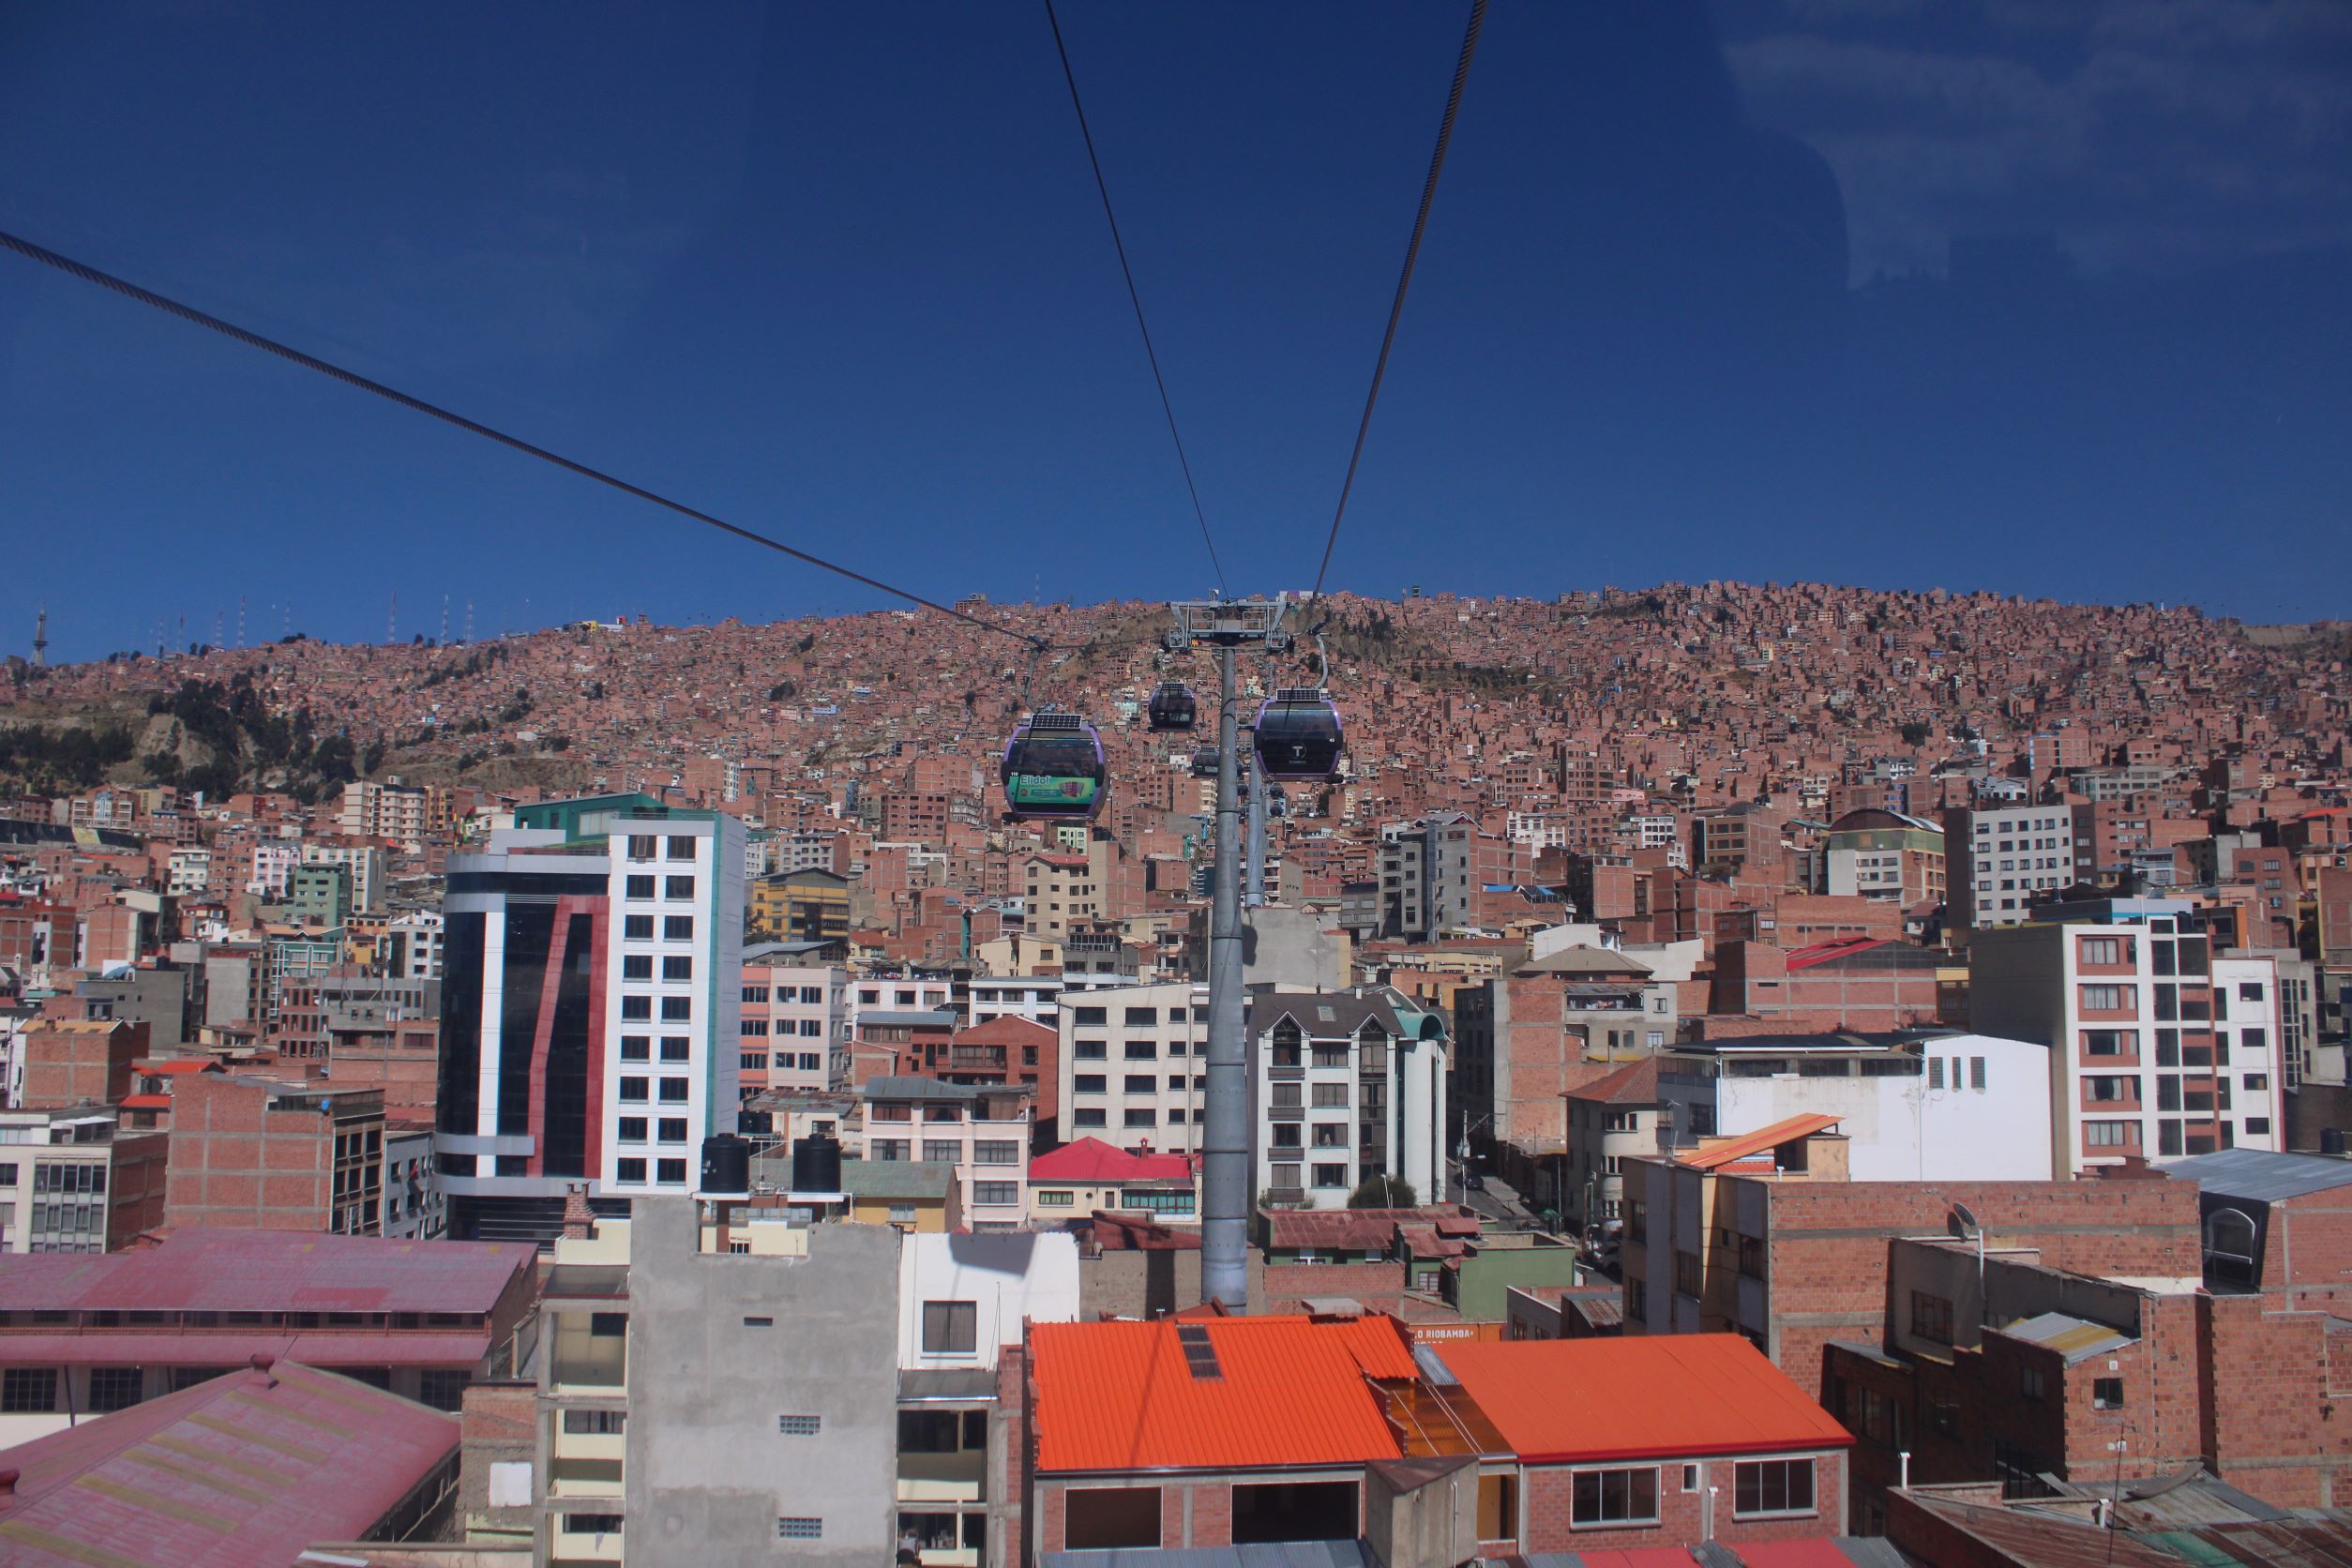
Among the many interesting attractions, we are going to focus on crossing the air space of La Paz city on Mi Teleférico while enjoying a magnificent view of the city. Mi Teleférico is a public system of transportation used by local people to overcome both the often jammed traffic and the steep streets of the city. It consists of 26 stations and includes 10 lines: Red, Yellow, Green, Blue, Orange, White, Light Blue, Purple, Brown and Silver. As shown in my pictures, you get to see a big portion of the city on any color line. Which really caught my eye when I got on my first ride back in 2016. Not only do you get to your destination faster, you get to enjoy the view of the city.
Pic 5: In city on the White linePic 6: Ground view of the Silver line
If you are like me, you might be wondering how this type of machine works? How can it hold a car full with passengers up in the air without falling? Gondola lift is a type of transport that is mainly supported by cables in a continuous system. What is a continuous system you ask? Great question, to my understanding it is a system that runs smoothly with no delay, a continuous relay of cable cars from station to station. The cable cars rely on the cable rope because the cable car itself has no sort of power, like an engine. The system is passed through a drive bullwheel and returning bullwheel which the car’s cable is attached to. What I didn’t know is that there are different grip installations on the cable, the fixed grip and the detachable grip. As they are named, the fixed grip is permanently attached to the cable as both the wheels turn. On the other hand, the detachable grip detaches the cable from the car letting passengers enter and exit at a reasonable time
Pic 7: Red Central Station feat. Illimani Pic 8: Close up of a cable car feat. Illimani
Pic 9: On the Purple line heading to the Pic 10. Purple Line going up to its station
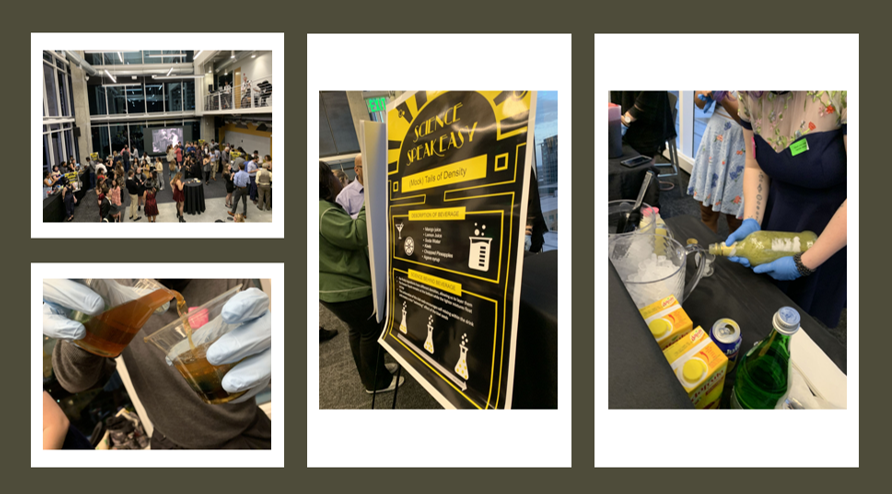
It was the evening of March 12 and the STEMcomm VIP team were in preparation mode for the Science Speakeasy. The Science Speakeasy was an event that was focused on eight different beverages where the science behind each beverage was explained to our fellow guests. Our event took place in the newly built Coda building of the Georgia Tech community. We were all eager to hold this event and have been waiting since 2019. It was an amazing experience to host before Spring break and eventually before we had to move to online courses. My group members consisted of Dr. Greco and Dr. Mendelson and they helped me make Xocolatl. I would like to share the recipe to those interested and hope you like it.
Xocolatl
Ingredients
⅛ cup Cocoa powder
1 Green chile pepper
2 ¾ cups Water
1 tsp Vanilla extract
honey/sugar (for sweetness)
cinnamon /cayenne pepper (extra spice)
Recipe (summary)
¾ cup of water and sliced green chile pepper (including the seeds) should be brought to a boil → 5-10 minutes
After boiled, strain the water to remove the chile pepper and the seeds and put water back in pot
Add the rest of the water and bring it to a boil.
While it is heating up, whisk the vanilla extract in.
Once boiling, add the cocoa powder and keep whisking → about 5 minutes
Froth should be appearing (might be small amount)
*All done: if bitter add necessary amount of honey or sugar
*want more spice, add necessary amount of cinnamon and/or cayenne pepper
This event was an amazing way to close out the shortened spring semester. Being involved in hosting the Sober Science Speakeasy for the Atlanta Science Festival and the Georgia Tech community, was a night to remember. With the help of our faculty advisors: Dr. Leavey, Dr. Evans. Dr. Greco and Dr. Mendelson and our classmates, this event was a success. Shout-out to Nadia and the band, you guys sounded great. Feel free to try out the recipe and hope to see everyone soon. Stay safe.
People have different preferences for how they want to follow what is going on around the scientific world without having to spend too much time seeking for information. However, seldom scientific information is presented in all possible formats that could satisfy diverse people’s preferences. Specifically, some information comes only in either auditory, writing, kinesthetic or visual. Although people may want to keep up with scientific events, particularly in topics that are of general concern, most of the time, that information comes in formats not always preferred by some groups.
Personally, I have noticed that visual formats help me to understand the information faster and a more complete way. Using visual aids, I am going to be discussing what brought my attention more than anything else these past weeks.
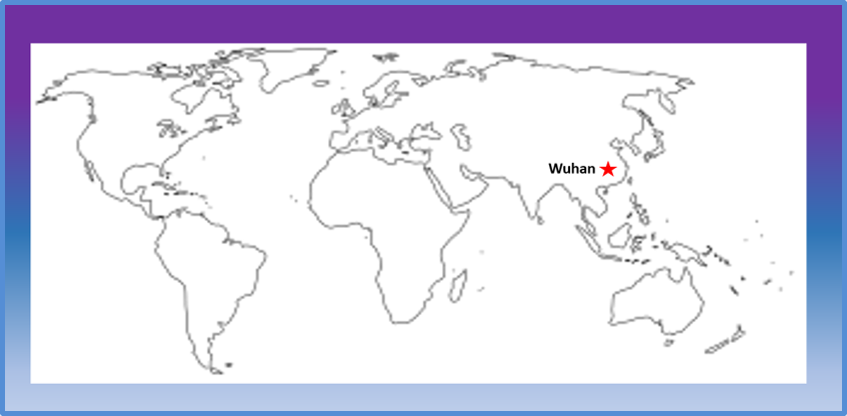
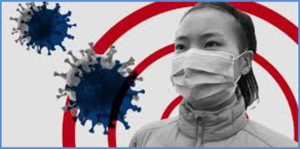
News about an outbreak caused by Coronavirus has been the top story during the last weeks. It started in China in December 2019 with a few hospitalized cases with respiratory infections. It originally spread throughout the city of Wuhan, but currently we are seeing cases in 26 countries around the world. As of today (February 7, 2020), there are more than 31,503 confirmed cases and it has already taken the lives of 638 people (5). The virus causes a severe illness – most confirmed cases were hospitalized– and could lead to permanent sequelae. The rate of premature death among confirmed cases is about 2%. Very little is still known about how the virus circulates and there is no vaccine to prevent infection nor known medications to treat its symptoms.
Sources have explained that this virus had some relation to seafood or live animal markets, which meant that the virus could spread from animals to people (1). Eventually they realized that some affected people have not been in contact with animal markets indicating that the virus could be transmitted by person-person contact. (1)
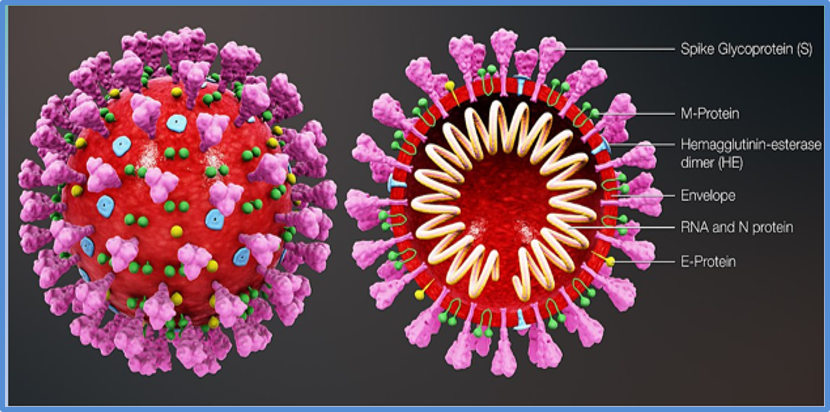
Genetically, the coronavirus, as seen in the picture above, is known to have spikes on their circular surfaces. Fehr and Perlman have concluded and identified that Coronavirinae has the largest identified RNA genome (2).Coronaviruses are generally a single strand of RNA and as the American Society of Microbiology mentions that since this family of viruses have a high frequency of recombination, this leads to problems when trying to detect the infection (3) Known as CoVs, these viruses can cause severe respiratory disease in animals and even humans. As in this outbreak, coronaviruses are known to be transmitted among people and animals, otherwise known as zoonotic
.
Symptoms are very similar to common respiratory infections. That can include runny nose, fever, cough and other similar symptoms (4). Since the symptoms are quite like common respiratory infections, it is harder to identify the Coronavirus or 2019-nCoV without a full-work laboratory test. In the presence of these symptoms both patients and doctors could believe it is just a regular respiratory infection. Moreover, since these months are considered high on influenza activity, these cases may well be confused for flu cases which could also lead to a severe illness.
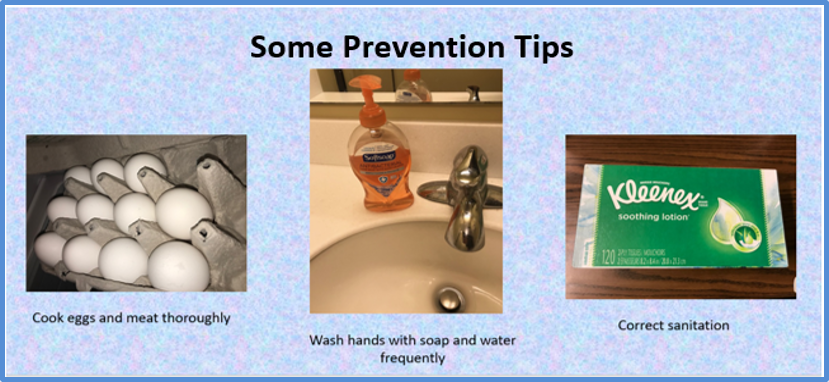
While the immediate risk of this new virus to the US public is believed to be low at this time, in order to prevent a Coronavirus infection, the World Health organization (WHO) and the US Centers for Disease Control and Prevention (CDC) advise to stay away from unprotected animals and possibly other infected people or with cold or flu-like symptoms. Additionally, frequently cleaning hands with soap and water or alcohol-based sanitizers and not to travel to places with active outbreak are important measures to prevent respiratory infections.
Now, the main concern from the public health organization nationally and internationally is to reduce the spread of the Coronavirus. More cases are likely to be identified and probably in more countries around the world. Since this epidemic is rapidly evolving and changing, there are still various uncertainties that will take time to figure out and much longer to put in place effective measures to monitor the disease, identify cases, isolate infected people, treat sick people and prevent new infections.
Fehr, A. R., & Perlman, S. (2015). Coronaviruses: an overview of their replication and pathogenesis. Methods in molecular biology (Clifton, N.J.), 1282, 1–23. doi:10.1007/978-1-4939-2438-7_1
CRISPR, an anacronym that stands for “clustered regularly interspaced short palindromic repeats,” is a concept becoming quite ubiquitous in most biology classes and rapidly gaining familiarity among experimental medicine and biology discussion circles not to mention scientific publications and health- or science-related news media. However, people who are not closely following these discussions or do not have a contemporary knowledge of genetics, understand very little about what exactly CRISPR could be or do. Even if one goes word by word for what each letter of the CRISPR anacronym stands for, it would be hard for the general public to have a workable idea of the science underlying this term. This article intends to provide an uncomplicate explanation of the concepts around CRISPR by resorting to a language that simplifies the ideas without decreasing the accuracy to the main concepts.
First, we may need to distinguish CRISPR, as a family of DNA sequences which is part of the immune system identified in bacteria cells, from CRISPR technology, as a tool to modify those DNA sequences in humans. Therefore, when scientists are talking about CRISPR and “trials in humans” they usually refer to a method used to modify the DNA genome in humans.
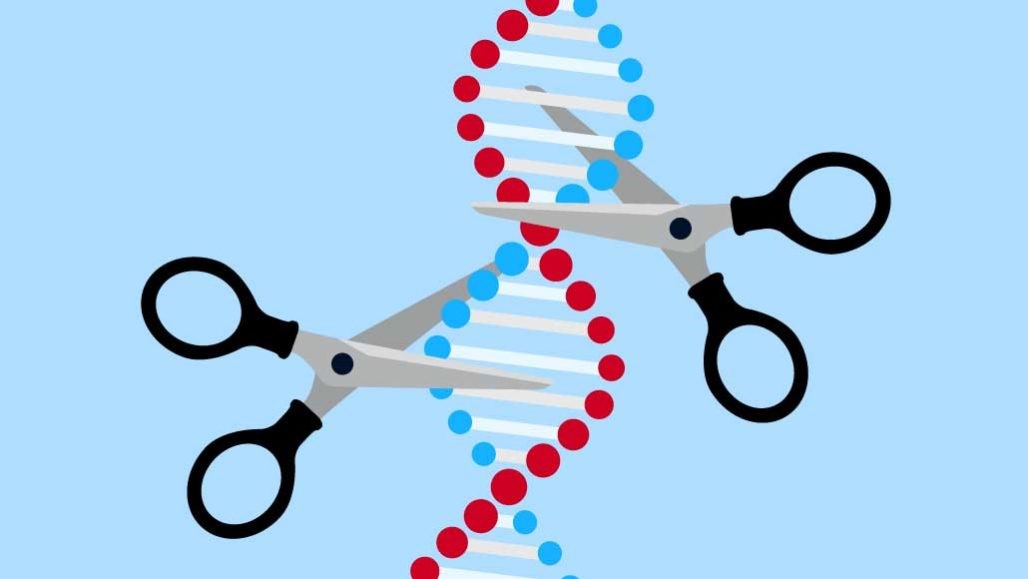
CRISPR has two components: the Cas9 which is a protein that can unwind and cut DNA sequences and the guide RNA (or gRNA) that recognizes the sequence of specific sequence of DNA to be edited. In some literature the CRISPR technology is also known as CRISPR/Cas9 in reference to a specific cutting protein – we will return to this concept below.
At least, three important questions arise here: How well is our understanding of the DNA sequences in cells? How well developed and precise are the tools to manipulate those DNA sequences? Why do we need to modify any part of the DNA sequences? The first two questions are not only quite related, but also involve a lot of uncertainty even for scientist working everyday with CRISPR technology. The third question involves not only the diverse therapies and diagnostic purposes for which CRISPR technology is being used but also the dangers and ethical dilemmas involved in the use of this technology. We will mostly focus on the third question while bearing in mind and revisiting the first two questions.
CRISPR is a system mostly known for the modification of DNA sequences to correct or delete any mutations or defect within the sequence of spaced DNA palindrome. In a practical way, it could be seen as spellcheckers of misspelled sequences and a cut-and-paste tool for DNA editing. CRISPR has been used in cancer patients, people with blood disorder and other possible diseases or defects that CRISPR could help to identify and correct.
To have a more precise idea lets return to the underlying concepts once more. The purpose of CRISPR technology is first to identify genes associated with CRISPR. Particularly relevant are those genes that could produce enzymes or proteins named Cris9 which are able to unwind and cut DNA, which were identified in the laboratories of Jennifer Doudna and Emmanuelle Charpentier and for which they received the Nobel Prize in Medicine.
With Cris9 at hand, it could be used to unwind and cut out specific strands of DNA (mostly those parts of the human genome that were previously identified as the mutations that cause unwanted defects or health problems). At that point, a specific gRNA is created to match that stretch of the DNA sequence that was cut. Next, after the gRNA is being attached to the DNA cutting enzyme Cas9, the complex formed by the Cas9 and gRNA is re-introduced to the targeted cell where the defect was detected. In other words, the enzyme cuts the strands of DNA at the specific human genome so that whatever is deleted can be properly replaced by a corrected part. In this case, researchers would remove some cells that are susceptible to a bacteria or virus or cells that show some unwanted mutation, modify the DNA in those cells and then put the modified cells back to potentially decrease the likelihood of a disease or defect.
Hopes, Slow Progress and Concerns
In general, CRISPR has been associated with a scientific revolution happening in medicine that would soon help us to better fight diseases, cure cancer, diagnose diseases or maybe even create new humans. The increasing understanding of how CRISPR works has given some hope and enthusiasm to scientist. Therefore, it is now frequent to find news about CRISPR being used in experiments.
However, we are in the early days of CRISPR and the progress is slow. In spite of the hopes, CRISPR has been used solely in a limited number of well-known mutations that cause certain diseases. This is an important limitation for various reasons. The number of unknown mutations is still quite large compared to the few known ones. Moreover, the mutations in the same place of the sequence of DNA of two individuals could be quite different and therefore the application of CRISPR to cut and correct such a mutation may work in some but not in all individuals. Even in the cases where the application of CRISPR in experiments with animals were relatively successful, for example the injection of corrected stem cells that let paralyzed rats walk again, when the same experiments were run in humans, they did not provide the same results.
The slow progress has not stopped the development of theoretical and laboratory models where CRISPR could be use beyond unwinding and cutting DNA, but also as a pointer and diagnostic tool. In the future, it is expected that CRISPR could be used in developing advanced patient therapies, customized medications and even cure life-long inherited diseases.
Ethical considerations
However, when CRISPR is associated with the “trials in humans,” a number of natural legitimate ethical concerns have been risen around the use of CRISPR. For example, it has become accepted the use in CRISPR in somatic cells such as T-cells to treat diseases, but when CRISPR is used in embryo or stem cells, it becomes controversial, mainly because genome modifications are done at germline level with unknown of unintended consequences for patients and future generations. In simple terms, the issue is the corrections at germline of a DNA sequence that could be passed to future generations by introducing heritable changes to sperm, eggs or embryos without full consideration of the risks or proper understanding of the participants.
This issue gained big relevance when a He Jiankui, a Chinese scientist, worked in the germline to modify the genes in twin kids (before birth), aimed to make the twins immune to HIV. This experiment was considered quite irresponsible and ethically questionable leading to a worldwide condemnation of the scientific community; the risks to the babies were higher than the benefits for a number of reasons: the parents provided consent without being properly informed, the CRISPR experiment was kept secret, He Jiankui ignored the ethical consensus against human germline genome editing. Due to this incident, regulations about when and how related research should be use in clinical treatment are being discussed and issued. Moreover, there have been even calls for a moratorium of clinical use of human germline editing.
Although still experimental, it is expected that one day CRISPR would arrive to the market. This creates another controversial set of issues. Who will have access to it? Would the cost be prohibitive for most people? Would CRISPR be similar to many new cancer or other high-tech medications and therapies with quite expensive price tags? Would CRISPR be seen as a discrimination tool via the market? These are open questions with no simple answers.
Beyond the ethical concerns, people may tend, out of fear, to magnify some drawbacks and minimize important merits (or vice versa) and so, could be sensitive to rumors or unprecise information. That is the case of non-therapeutic uses of CRISPR. The idea that CRISPR could be used for frivolous ends (i.e., phenotype “corrections” like cosmetic surgery for aesthetics) is a frequent misconception about what CRISPR could do. In general, it should be mentioned that the state of arts in genetics is not quite there yet to attempt any phenotype “correction.” Simply put, science does not know exactly what the consequences are of changing some genes.
In conclusion, editing CRISPR genome allows scientists to quickly create cell, which can be used to accelerate research into diseases such as cancer and mental illness. Also, CRISPR is now being developed as a rapid diagnostic tool. However, CRISPR is still in its early days of and there are still scientific and ethical limitations to take into consideration
Zhan Y, Sastre D, Wang F (2018). CRISPR/Cas9 Genome Editing: A Promising Tool for Therapeutic Applications of Induced Pluripotent Stem Cells. Curr Stem Cell Res Ther. 2018;13(4):243-251. Available online at: https://www.ncbi.nlm.nih.gov/pubmed/29446747