Tag: math

  • Origami 101

    What is Origami?

    Origami does not originate from a sole inventor, it was crafted over centuries by many different hands for various ceremonial purposes in Japan and even China (Robinson, 2026). The word we use today, origami, is derived from the Japanese words ori which means folded and kami which translates to paper. While paper itself was first developed in China before spreading to Japan, folding paper into decorative and symbolic forms became especially refined in Japanese culture over time. Early uses of folded paper included religious ceremonies, gift wrapping, and formal exchanges, where presentation held great meaning.

    Fast forwarding centuries, today origami is seen worldwide. A simple YouTube search nowadays can teach even the newest of the new how to craft an origami chameleon, like how I learnt! What was once a traditional practice has now grown into a global hobby, mathematical practice, and even an area of scientific research.


    Math, Science, and Folds

    It comes to no surprise when we see the intricate works by masterful artists, that the art within folding comes from mathematical roots. For example, take the common fold that basically all origami pieces start with: the square piece of paper folded diagonally corner to corner and then along the sides, top to bottom and left to right. These folds create lines of symmetry and reference points that help guide more intricate folds later on. Mathematically, these folds create either a valley or mountain based on the value of the angle between the two adjacent planes created by the fold (Kunz, 2024). A valley fold bends inward like a “V,” while a mountain fold rises outward like a mountain. By combining these two simple fold types in different orders, locations, and sizes, folders can create highly detailed animals, flowers, and geometric structures. 

    Additionally, origami also has strong roots in more of a geometric application of math, with many models and folds often relying on fractions, bisectors, symmetry and so much more. In the scientific world, origami has received its share of the spotlight from inspiring compact folded solar panel designs for satellite use to shaping medical stents used in patients. 


    My Folds and Why I do it

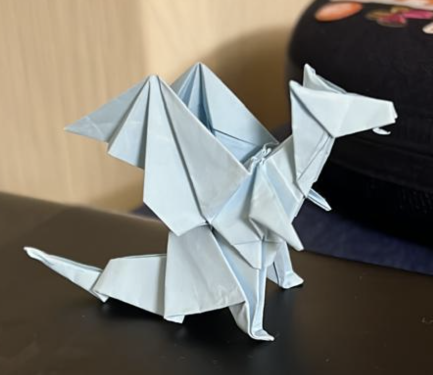
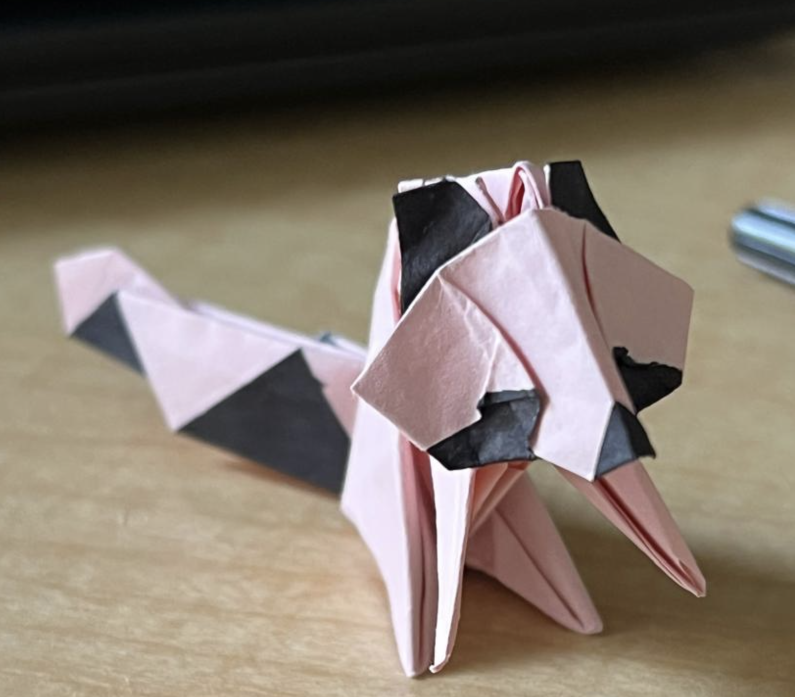
    My goal when folding is simple: just don’t make it ugly. I find my inspiration, to recreate art through online tutorials, to be fueled by the passion and creativity of others. I folded the blue origami dragon below to surprise one friend, and the raccoon for another. I trace my folding skills back to one main motivation: wanting my creations to be as perfect as possible for the people around me. I have made plenty of lousy folds, but never when I feel a real sense of purpose behind them. When I fold for someone else, I tend to care more, focus more, and try as hard as I can. I am happy to say I will keep carrying on origami traditions. Mine may not be embedded in ceremonial, mathematical or even scientific purposes, but they still come from a place of creativity, curiosity, and humanity.
    References

    Origami created and photographed by Kristina Siju

    Origami with Jo Nakashima. (2021, September 14). ORIGAMI CHAMELEON (Jo Nakashima ). YouTube. https://www.youtube.com/watch?v=if7iSuzNn38

    Nakashima, J. (2015). Origami Dragon (Jo Nakashima) [YouTube Video]. In YouTube. https://www.youtube.com/watch?v=kUsxMXwCW8A

    Muneji Fuchimoto ORIGAMI CHANNEL. (2020, December 8). 「折り紙」アライグマ(racoon origami)の折り方. YouTube. https://www.youtube.com/watch?v=X2FYuvt-U80

    Geometry – Ancient geometry: abstract and applied. (n.d.). Encyclopedia Britannica. https://www.britannica.com/science/geometry/Ancient-geometry-abstract-and-applied

    Thesis, B., Kunz, C., & Cannas Da Silva, A. (2024). Mathematics of Origami. https://people.math.ethz.ch/~acannas/Student_Papers/BSc_Theses/2024_bsc_kunz_mathematics_of_origami.pdf
  • Why Is Math So Hated?

    “What’s your favorite subject?”

    “I’m not sure… just definitely not math. What’s yours?”

    “Oh, funny story…”

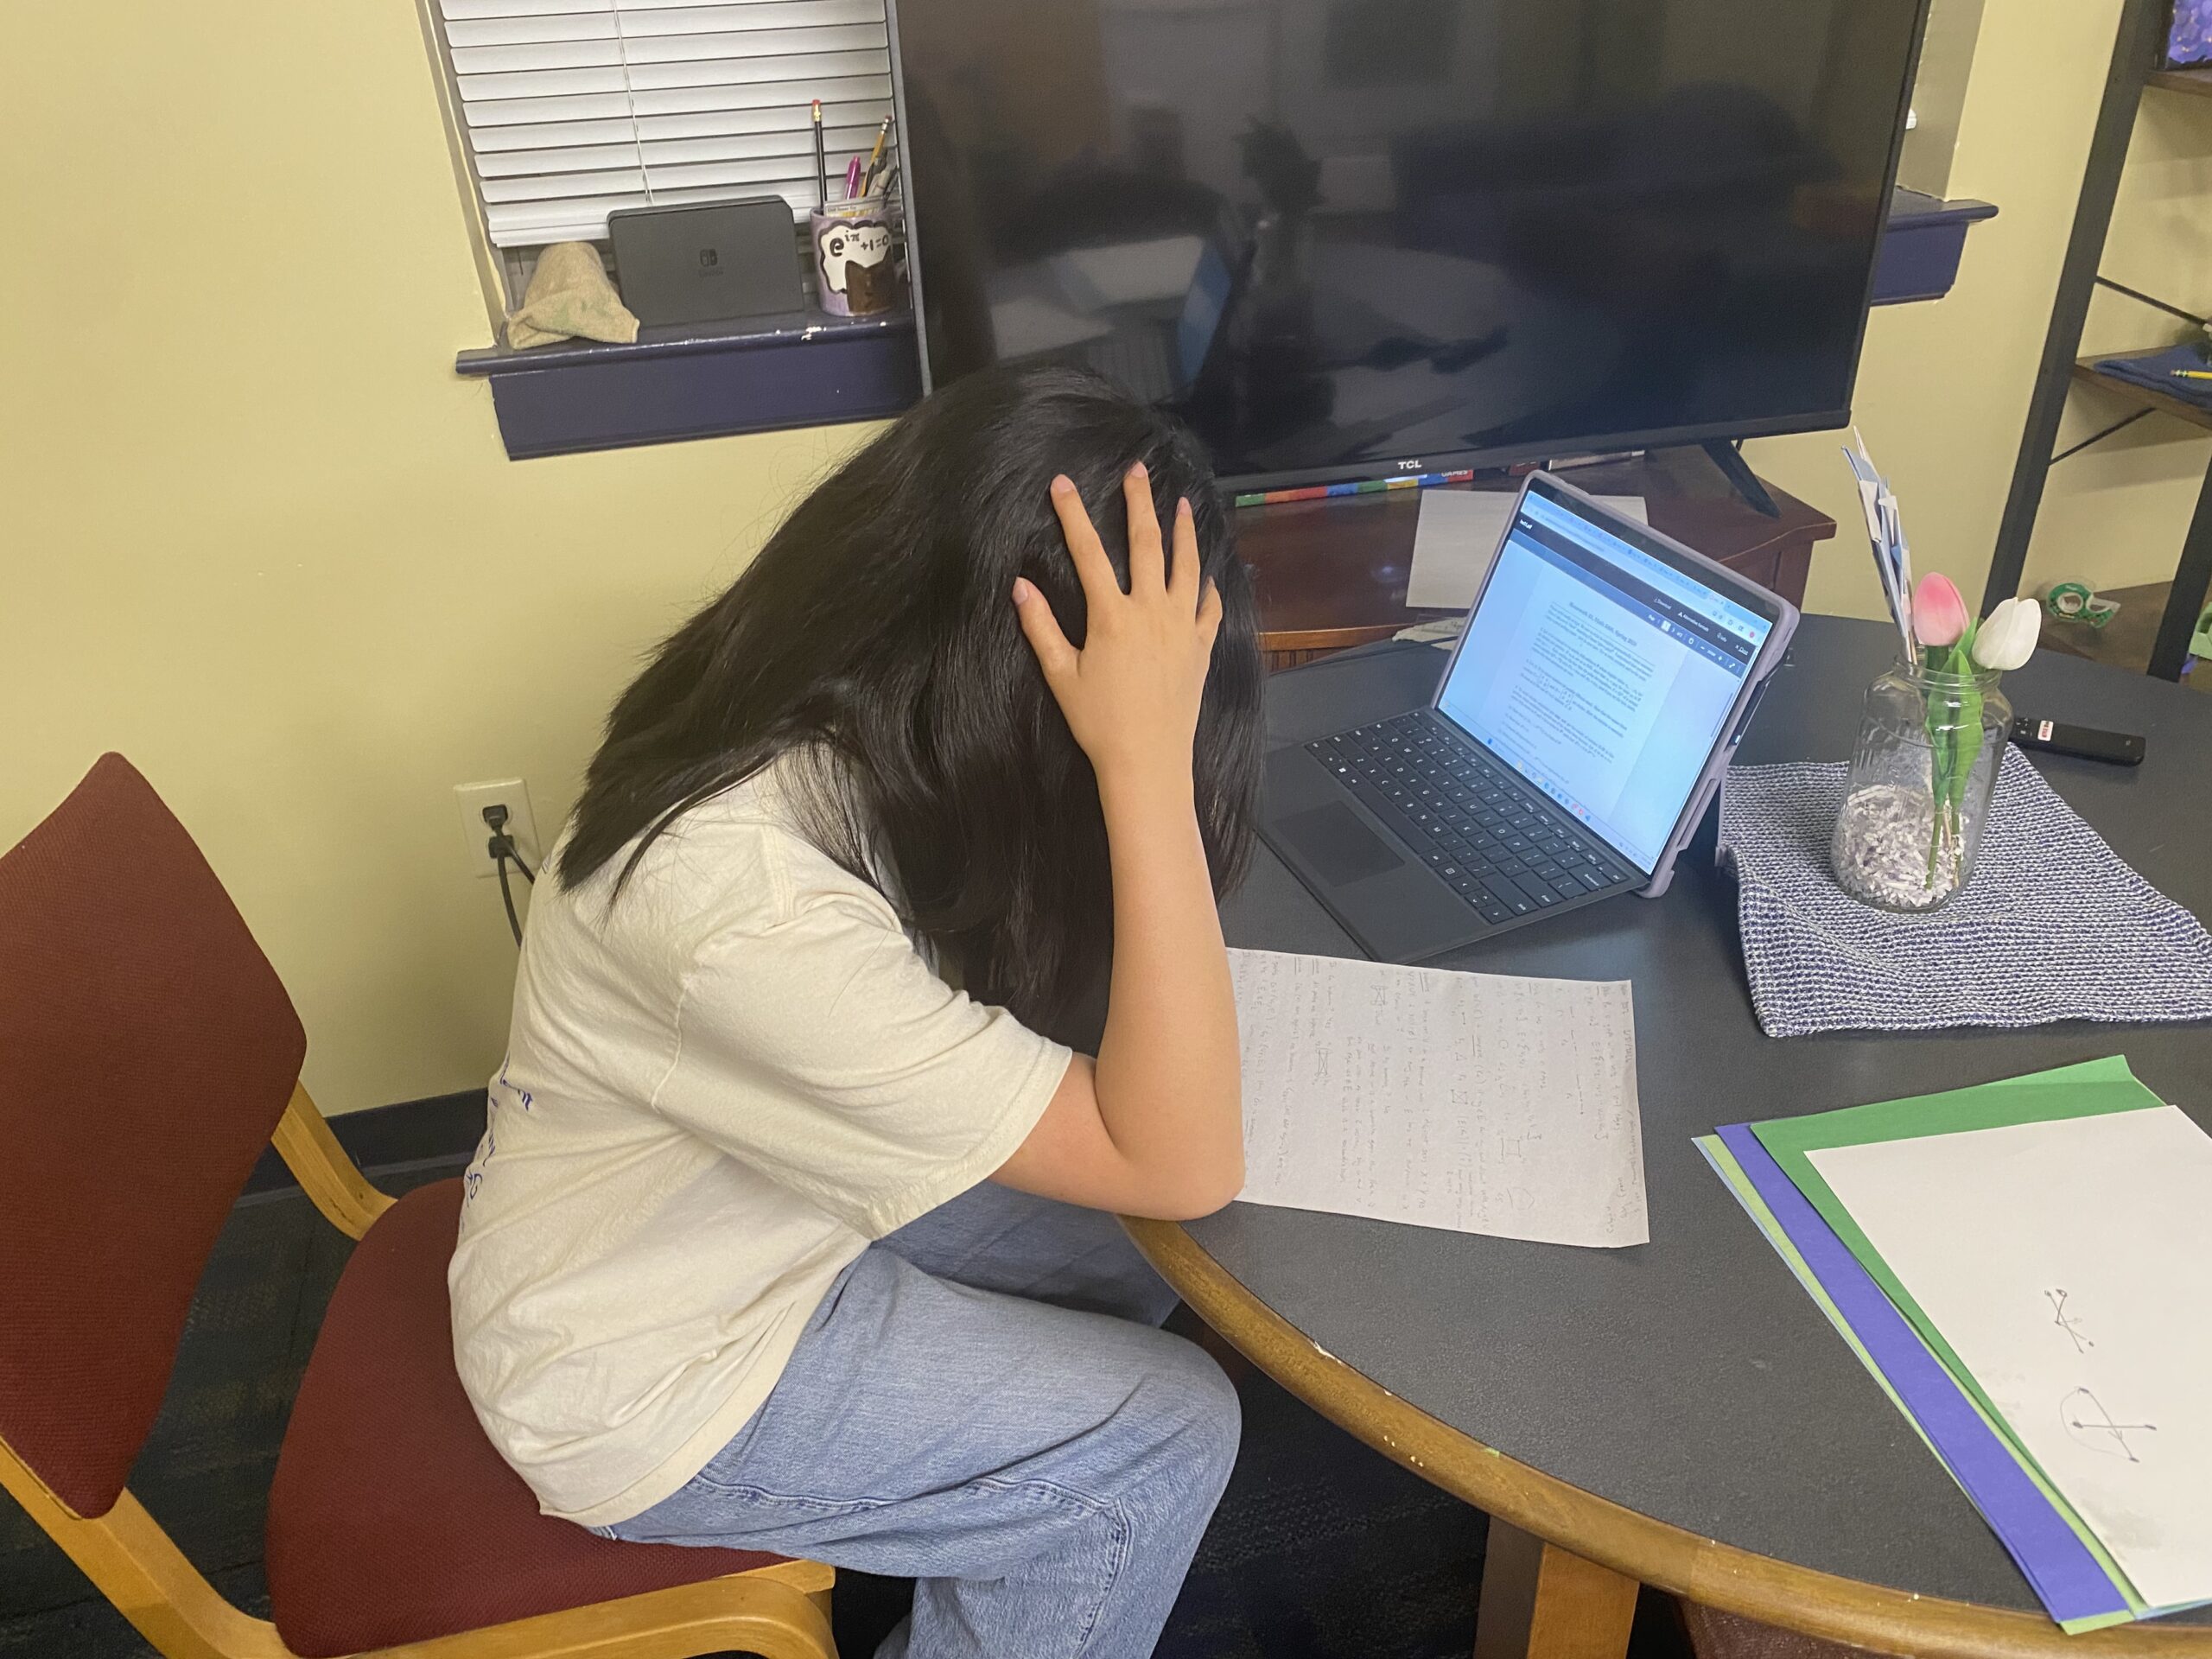
    Ah yes, math, the subject notorious for being one of the hardest subjects in school, with “math anxiety” being the term coined for the fear of math. If you’re reading this, you’ve most likely been through the agony of a difficult math class or teacher that just didn’t understand you. As a math major and someone who loved math as a child (but also had their share of math difficulties), I sought out to understand why math is so hated, and if there is anything we can do to change that. After all, I was able to see firsthand how cool math is and my hope is that more and more people will be able to as well.

    How Math is Taught in School

    Many students point to the difficulty of math when asked why they dislike it, as shown from this table, where math being hard was listed as a reason almost twice as much as it being boring (Stodolsky et al., 1991). Therefore, we should look to how math is taught in school to see why students are struggling so much. In general, many math educators teach in a more computationally-focused way, prioritizing students’ abilities to memorize concepts and algorithms to be able to complete a problem set, rather than letting them discover the math on their own or letting the students know the “why” behind what they are doing (Stodolsky et al., 1991). This was certainly my experience in some of my classes, where when asked why something works the teacher would just say “don’t worry about it.” This can cause students to be confused on how to follow the steps given to them to solve a problem or give them difficulty when trying to memorize them for a test. If students knew all of the derivations to the formulas they were using, I think they would be more likely to remember it and boost their problem-solving skills than if they regurgitate a step-by-step process given to them.

    Gender Stereotypes Regarding Math Ability

    If you’re a girl, you may have heard it at least once in your life: “You’re a girl? You can’t possibly be good at math or science, you belong in humanities (or the kitchen).” Or perhaps, you’ll be the only girl, or one of a few, in some advanced STEM class. One study was held testing children in a few different categories: math performance, math anxiety, and test anxiety, collecting data over different grades for boys versus girls. The study found that higher math anxiety had more of a negative effect on girls than for boys (Erturan & Jansen, 2015). This is likely due to the aforementioned  stereotypes that boys are better than girls at STEM related subjects such as math, putting more pressure on girls when testing. Even if they might know the content, these stereotypes can put doubt into girls’ minds about whether or not they are capable of doing well in math.

    Intergenerational Effects on Math Anxiety

    Math anxiety has existed for a long time, not just in this generation, but in those of our parents and grandparents as well. As a result, it makes sense to consider the possibility that it gets passed down from generation to generation, not necessarily through genetics, but through parents’ attitudes towards math rubbing off on their children. Another study on math anxiety investigated the role that parents played pertaining to their children’s levels of math anxiety, by testing students’ reading and math performance and giving parents questionnaires to determine their levels of math anxiety. The study revealed that there was a negative correlation between a parent’s math anxiety and their child’s performance, but only when the parent was significantly involved with helping the child with their homework (Maloney et al., 2015). It is speculated that the cause of this is the parents letting out their own negativity towards the subject to the child, expressing their frustration which caused their children to also have higher levels of math anxiety and do poorer on their tests.

    What To Do?

    It is clear there are many outside factors that can cause a child to dislike math, so  how do we combat this? Even if we don’t like math that much ourselves, we can try our best not to project that mindset onto young minds and instead, encourage students to develop a growth mindset (Mendoza, 2025). With some work, it would also be beneficial to make a few changes to the way math is taught in school by making learning more interactive and prioritizing understanding over memorization. And hopefully, maybe one day, math will not be considered the “hated” subject but simply just a subject that more people enjoy.


    References

    Erturan, S., & Jansen, B. (2015). An investigation of boys’ and girls’ emotional experience of math, their math performance, and the relation between these variables. European Journal of Psychology of Education, 30(4), 421–435. https://www.jstor.org/stable/24763249

    Maloney, E. A., Ramirez, G., Gunderson, E. A., Levine, S. C., & Beilock, S. L. (2015). Intergenerational Effects of Parents’ Math Anxiety on Children’s Math Achievement and Anxiety. Psychological Science, 26(9), 1480–1488. https://www.jstor.org/stable/24544088

    Mendoza, K. (2025, February 28). 9 Strategies to Help Students Love Math – Oxford Learning. Oxford Learning. https://oxfordlearning.com/9-strategies-to-help-students-love-math/

    Stodolsky, S. S., Salk, S., & Glaessner, B. (1991). Student Views about Learning Math and Social Studies. American Educational Research Journal, 28(1), 89. https://doi.org/10.2307/1162880

  • What’s The Connection Between Complex Chemistry and Islamic Medieval Architecture?


    karbala, iraw


    The expansive domes and minarets of famous mosques such as the Blue Mosque in Istanbul or Al-Masjid An-Nabbi in Medina exude a quiet, powerful energy. Oftentimes these are characterized by a large, stone courtyard. You walk through the simple, colorless path towards the mosque entrance. You feel cleansed, as if you’re leaving a part of the world outside; it’s almost unsettling. At a first glance, you could describe these mosques as plain. Crossing the threshold, however paints a different picture. Your sight is overloaded with bright jewel-toned colors: azure, emerald, turquoise, fuchsia, red. It’s hard to focus on one detail – will it be the gold leaf, intricate etch work, milky marble, shimmering glasswork? You are humbled standing underneath the enormous ceilings.

    The glittering shrines and mosques that characterized medieval Islamic architecture are more than just a pretty sight, but in fact the product of geometrical planning. Aside from the lavish materials and colors, it is the tiling patterns that make the architecture stand out. These patterns are featured prominently in Islamic arts as a substitute for more figurative images. The reasoning was that images depicting people would lead to idol worship. Inside the mosque, you see these tiles plastered densely together on the ceilings, the columns, the minarets, the free wall space.(*)

    Islamic interlacing patterns can be divided into two categories: the arabesque versus girih. While arabesque designs feature more curved elements in an effort to emulate greenery and nature, the girih is composed of geometric lines mostly of stars and polygons with interlaced lines. Muslim architects designed the girih tiling system with only two simple tools: a compass and ruler. These patterns became complex tessellations made up of up to five different shapes: the bowtie, rhombus, pentagon, elongated hexagon, and decagon. Between the 1200s to 1400s, Islamic art developed the girih exhibiting the same complexity as quasi-crystals, a material that defies normal atom packing. Back at the mosque, you trace your fingers along the figurative tiles that blend seamlessly. A lime green pentagon here, an ivory star there.You see that the tiles are made of contrasting colors with a multitude of small shapes.

    Quasi-crystals are made of patterns that look regular but do not repeat exactly. The patterns in Islamic architecture demonstrate this by including “tessellations” that have five, ten, and twelve-fold symmetry. Technically, they are are not actually patterns, but just appear to be so. Scientists conjecture that Islamic architects wanted the effect of extend a pattern without just repeating images. Looking up at some of the mosques ceilings confirms the success of this design – you feel as if you are swallowed by the dizzying depths of shimmering oceans and bright stars.500 years later mathematical physicist, Roger Penrose at University of Oxford discovered the concept of quasi-aperiodic tiling. Sir Penrose stumbled upon a pair of tiles that cannot form a pattern in a periodic manner. This discovery was just a consequence of his work on the famous tiling pattern in mathematics – “given a collection of polygonal shapes, is it possible to cover the whole plane using just these shapes, with no overlaps?”

    Quasicrystals are found mostly in metallic alloys such as (Al-Li-Cu), and lack translational symmetry. The discovery of the non-symmetrical packing of atoms took a while for the scientific community to accept. Although first discovered in the 1960s, much of the scientific community refused to believe that materials could consist of irregular atomic structure. Next, materials scientist, Dr. Dan Shectman, designed an artificial alloy with quasi-crystal properties. He did not publish his results for years because he feared that others would ridicule his work.  Only after researcheres found a  natural quasi-crystal, icosahedrite in the Koryak Mountains, Russia in 2009 that led people to be convinced. Shectman received the Nobel Prize in Chemistry in 2011 for this work.

    Researchers connected Islamic girih and quasi-crystals recently; Dr. Peter Lu a physicist from Harvard University recognized ten-fold symmetry in architectural motifs while visiting Uzbekistan.  He analyzed 3700 Penrose tiles found in an archive of documented medieval Islamic architecture, and published a paper with Princeton University’s Dr. Paul Steinhardt titled ”Decagonal and Quasi-Crystalline Tilings in Medieval Islamic Architecture”. Dr. Lu uses the Darb-I-Imam Shrine in Iran as the iconic “near perfect” example of Penrose tiling. He conjectures that laborers could easily have created mathematically complex patterns by lining tiles decorated with lines that, once set down next to each other, form a continuous pattern.

    Back at the mosque – you see a worshipper prostrated to the ground, oblivious of the art around them. Their hearts disconnected from the ancient mathematics and chemical mimicry in which they are enclosed in. Science and spirituality; a Nobel prize in chemistry yet also an artform. These two paradigms reside side by side in the glorious, kaleidoscopic patterns of centuries old Islamic architecture. There is an elegance in the scales that aperiodic tiling has reached – from the utterly microscopic crystals to the gigantic mosques that can hold thousands of people.

  • Mistaken concepts: the taste buds

    OK, kids, we need to talk. No, you’re not in trouble. The people in trouble are health, anatomy, and psychology teachers who try to teach a specific concept that is WRONG.

    Any guesses about what connects those teachers? No? Well, here’s the offending diagram.

    Don’t believe images like this. EVER.

    That, my lovelies, is a picture of a tongue. But see those cool segments that tell you what flavor is tasted by each segment of the tongue? They’re completely and totally unnecessary. Your tongue doesn’t work that way, despite what so many teachers and even college professors would have you believe.

    No, don’t try to look all cute and happy, Mr. Boring. You’re on scientific trial here.

    Let’s go back a bit to Harvard University circa 1901. A psychologist, Edwin G. Boring (more like Edwin G. Mistaken-Fact-Check) misinterprets data in a German paper, leading to the belief that each region of the tongue is specialized to taste exactly one of four basic flavors.

    “OH! Cool!” he says, thinking this break-through will change the way we interact with food (or something).

    Trust me, it didn’t.

    Let’s fast forward to 1974, when Virginia Collins discovered that all tastes are distributed equally across the tongue. Case closed, right?

    NOPE! People are STILL using the tongue map to explain taste buds in 2012!

    Let’s expand your knowledge a bit, though. Why is this tongue map concept so incredibly insulting to the science of taste? Here’s three big reasons why!

    Well, first off,  it is incorrect in the count of basic flavors. The map shows the four flavors (bitter, sour, salty, and sweet) that were known in 1901, but there are at least five that we know of now. The four that are on the map DO exist; the fifth wheel of taste we use at a wine and cheese party is actually one of the most important – umami. That’s the taste of savory things like meat and cheese, and was described as early as 1908, a mere seven years after Boring made his translational mistake.

    Secondly, the map claims the receptors for each flavor only exist on the edges of the tongue, the very back, and the very tip. That leaves a HUGE bit of space that doesn’t really do much, right smack in the center… where most food hits the tongue.

    Um. Science says, “Whoops?”

    It’s an impractical model from the start, is what I’m trying to say.

    Thirdly, our sense of taste is much more important in basic development and exploration than the map allows for. From the time we are born, we explore the world through all of our senses. Senses like sight don’t fully develop until we are between 6 and 18 months of age, but we make up for what we lack by using other senses, taste, in the case of infants.

    Well, why is that particularly important, you ask? Because of chemistry. The basic correlation between chemistry and taste is that acids taste sour and bases taste bitter. The safest way of testing this is to taste a lemon, which is full of citric acid. It’s sour, right? Right.

    Since things that are bitter are not necessarily desirable as food products, it’s very difficult to find them on market shelves. Egg whites and some crackers are the closest edible things you’ll find to basic foods.

    Now, think back to childhood…. Do you think a baby would like something that tastes bitter? NO! That’s a natural response. It’s a safety precaution, too; bitter foods tend to contain deadly chemicals, like ammonia. According to the tongue map, those substances would have to hit the back of the tongue to be tasted, which probably means someone is going to have to call poison control because little Johnny has swallowed ammonia instead of spitting it back out because he tasted that bitterness immediately.

    So, lesson of the day? Don’t think of the tongue as some city planner’s way of keeping the taste bud gangs from having turf wars. It’s much more accurate to think of it as a metro area, where everybody mixes and coexists while doing their jobs.


    O’Connor, Anahad (November 10, 2008). “The Claim: The tongue is mapped into four areas of taste”. The New York Times.

    Hänig, David (1901). “Zur Psychophysik des Geschmackssinnes”. Philosophische Studien 17: 576–623.

    Wanjek, Christopher (August 29, 2006). “The Tongue Map: Tasteless Myth Debunked”. Livescience.com.


    Image sources:

    www.leavingbio.net

    www.igs.net/~pballan


  • Pick a Door, Any Door

    Pick a Door, Any Door

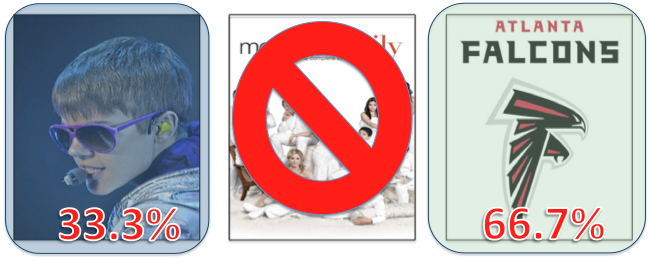
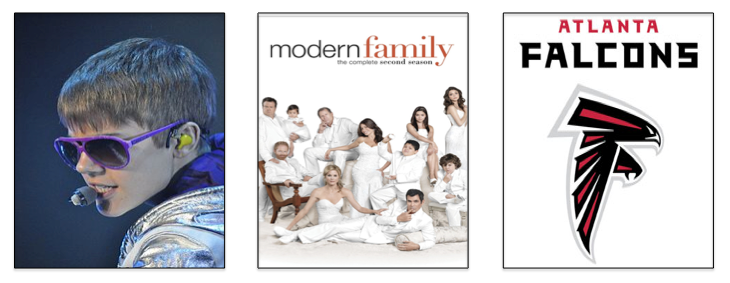
    You’re trapped in a bland room with absolutely nothing but three ordinary, poster-plastered doors. The first door is covered with pictures of the teen pop star sensation, Justin Bieber singing in front of an audience of entirely teenage girls (roughly the composition of his entire fan base). The second door displays a montage of the cast of Modern Family, the TV show, which seems to have grasped the public’s short attention span for the time being. And lastly the third door includes a very sharp arrangement of Atlanta Falcon paraphernalia. You are told that behind one of these doors is a free ticket to any concert of your choosing, but behind the other two doors are free (did I mention enforced?) enrollment courses to…drum roll please…SAT classes! Your parents, who happen to spontaneously appear in your room, instruct you to choose any of the three doors and claim the “prize” behind it. Which door do you pick? Chances are if you value talented musical artistry, you’re at least not going to choose the Bieber door. Alright, alright, enough with the Bieber jokes. So you pick a door, the Bieber door. Now the catch is, your parents don’t open the door you chose. Instead, they open one of the other two doors (let’s just say the Modern Family door) and lo and behold, you get glimpse of the dreaded SAT class. Now, your parents offer you the once in a lifetime opportunity to either change your choice to the Falcons door or stick with Bieber. What do you do?

    This problem is essentially the teenage equivalent of the Monty Hall Problem,which you may recognize from the movie 21 directed by Robert Luketic and starring Kevin Spacey, Jim Sturgess, and Kate Bosworth. In this movie, the professor Micky Rosa, played by Kevin Spacey, poses a perhaps less embellished version of this dilemma to a student Ben, played by Jim Sturgess. Ben, being thoroughly well-versed in the principles of probability and statistics, decides to change his door. Why? The truth is that this entire problem is designed to play into the decision maker’s emotional bias. My version of the problem may attempt to do this more so than other versions given the decals on the faces of the door, but what’s life without a little imagination? While the scope of the movie 21 incorporates more than just this 5-minute scene, I wanted to take the time to investigate the mathematics behind this choice.

    When you first pick a door, there is approximately 33.3% chance (1/3) that your door contains the coveted concert tickets and about 66.7% that the doors you didn’t choose contain the tickets.
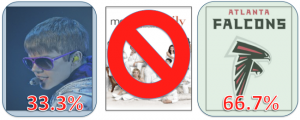
    When your parents open one of the other doors to reveal the SAT class, how has the situation changed? Probability dictates that since your door has a 33.3% chance of containing the tickets, the remaining door now has a 66.7% chance of containing the tickets.
    Thus, in reference to our earlier example, the conditional probability that the Falcons door contains the prize given that you originally chose the Bieber door and that the Modern Family door contains the SAT class is approximately 66.7%.

    Still aren’t convinced? Try thinking about the problem in the context of 100 doors. Your original door has 1% chance of containing the prize while the other 99 have an added total of a 99% chance that one of them contains the prize. As 98 of those 99 doors are exposed as “phonies”, the last door standing has a 99% chance of containing the prize as it has managed to outlive a 98-door elimination process. Now if you still don’t believe me, I encourage you to try it out! Take three cups and put a ping-pong ball (or any quiet object) under one of the cups. Then have a friend guess which cup contains the “prize”. Open one of the other cups (one not containing the prize) and ask if he wants to switch. Consistently run this experiment using his original choice regarding switching. If he chose to switch, he should be winning about 2/3 of the time. If he chose to stay, he should be winning about 1/3 of the time. Stay tuned for future posts about Math & Movies!

    Image Sources:

    Justin Bieber: wikipedia.com

    Modern Family: wikipedia.com

    Atlanta Falcons: ticketmaster.com