Category: DIY

  • LaTeX: A Typesetting Guide

    As an aspiring scientist, I look to encourage as many people as possible to read what knowledge I can share. Technology has made that incredibly easy, as proven in history by the boon caused by the printing press. A huge proponent of sharing information is the accessibility to a wider audience, and part of that leads to a discussion on aesthetics and formatting. Even now, I’m aware of the way that each indent in this article will help make it easier for you, the reader.  In science, there is so much data and foundations to cover to be able to support all of these knowledgable ideas and to get to that quicker, the LaTeX Project has made it easier to streamline all of this together so that scientists can do what they do best – share their knowledge. Now, I hope at this point you’re aware that the LaTeX project has nothing to do with gloves commonly adorned by doctors, or the red suit that Velma (our new lesbian icon) wore in the Scooby-Doo live-action movie. If not, let me explain. From the site itself, “LaTeX… is a document preparation system for high-quality typesetting… often used for… technical or scientific documents,” (The LaTeX Project.org). During a semester where all but one of my professors strongly encourages submitting all work in LaTeX, and previous reports submitted under the guidelines of the American Physical Society, I felt it part of my duty to share some wisdom on the subject of writing in LaTeX.

    To start, I use the online tool Overleaf to work in LaTeX, but there are other options such as TeX maker to start your LaTeX journey. My personal preference is Overleaf, but TeX maker may be helpful if you often find yourself without internet connection and still needing to edit your .tex files. 

    When creating a new project, I try to keep in mind what my purpose for the document is, and if I need a specific template (either offered through Overleaf or some I have made on my own). Often, I just make a copy of the template I have made for homeworks and continue editing it to the specifications of the class I am using it for. Othertimes, I’ve used some of the resume templates to try my hand at that. Of course, each project is different, so its good to experiment on your own with different possibilities!

    In all projects, there exists the title and metadata, where I can note that I am the author, list co-authors, the date, and more, all contained within the preamble section. The preamble section is where the outline of the formatting is, and a bank for all the tools you may need as you go. One of the most useful parts of the preamble is the selection of packages you include, as it widens your ability in what you’re able to accomplish in the document. For example, if you would like to show images, there’s a package called graphicx to help neatly organize the image onto the document and minimize the struggle of neatly fixing it in place. As a physics major, the packages I might use most often are: amsmath, amsfonts, amssymb, graphicx, physics, sinunitx, mathtools, verbatim, and more. You may find some other helpful packages for your own use! Moreover, the preamble is where it is stated what class the document falls under – such as article, report, book, and so many more options with even more available modifications.

    Then, the document begins. Literally. The first environment, typically indicated with the “\begin{ }” (and “\end{ }”) command,  is introduced immediately after the preamble, as the document is its own environment. Whatever is typed outside of the environment will not directly be reflected onto the pdf version (unless it is formatting stated in the preamble). If I were to re-create this article in LaTeX, the first thing I would do in the document environment would be to use the command “\maketitle” so that it could take the title from the preamble and format it neatly. I could also make a section called the Introduction to let you know what the paper was all about! Sections are helpful to organize the document to make it easier on the reader, and can especially be helpful for lab reports. To create sections, you’d use the “\section{}” command, where you’d put your section title in the argument of the command. For example, let’s make an Introduction:

    And without touching any fonts, bold, or anything like that, we have the start of a LaTeX article!!!

    Before continuing on, allow me to clear up some basic syntax of LaTeX. As we’ve seen with the “\section{}” command, we have arguments (args) that are usually represented with curly braces: {}, and in some cases extra parameters are in straight braces: []. One common example is “\usepackage[utf8]{inputenc}”, where this (as far as I know) is a basic formatting setting. With the section command, we inputted “Introduction” to the argument so that we could name the section. Additionally, like most programming languages, there is a way to put comments in the coding portion of LaTeX that doesn’t show up in the pdf version. This is very helpful to explain new commands you’ve created or directions for a template. The comment is indicated with “%”. Anything typed after this on a line will not show up until you go onto a new line. If you would like to manually create a vertical spacing delimiter (in other words, a new line), you can use “\\”. This is not indented for the next paragraphs you may start. For horizontal spacing delimiters (simlar to the tab key) you can use “&”, which you will most commonly see in creating tables. These are the most likely syntax related things you will come across (other than the escape key)!

    As helpful and streamlined as this all is, many people may still prefer to use Word or Google Docs over this. So why use LaTeX? Two words. Math mode. It’s important to note that math mode has its own syntax, but it isn’t too much more! In STEM, math mode is extremely helpful because it allows you to easily format and include equations and other mathematical work.

    Some common environments in math mode include equation, gather, and align. Gather and align can help a lot more when there are multiple relevant pieces of mathematical information at once so they can be formatted well. The equation environment is helpful for textbook-style math where you can choose to number each one or not!

    Something else in math mode that is common, be it for a homework problem or simple discussion of the math, is using in-line math. This is where you don’t isolate the equation from the paragraphs, but simply keep it in-line with the words so that it’s all one neat paragraph. Let’s try it!
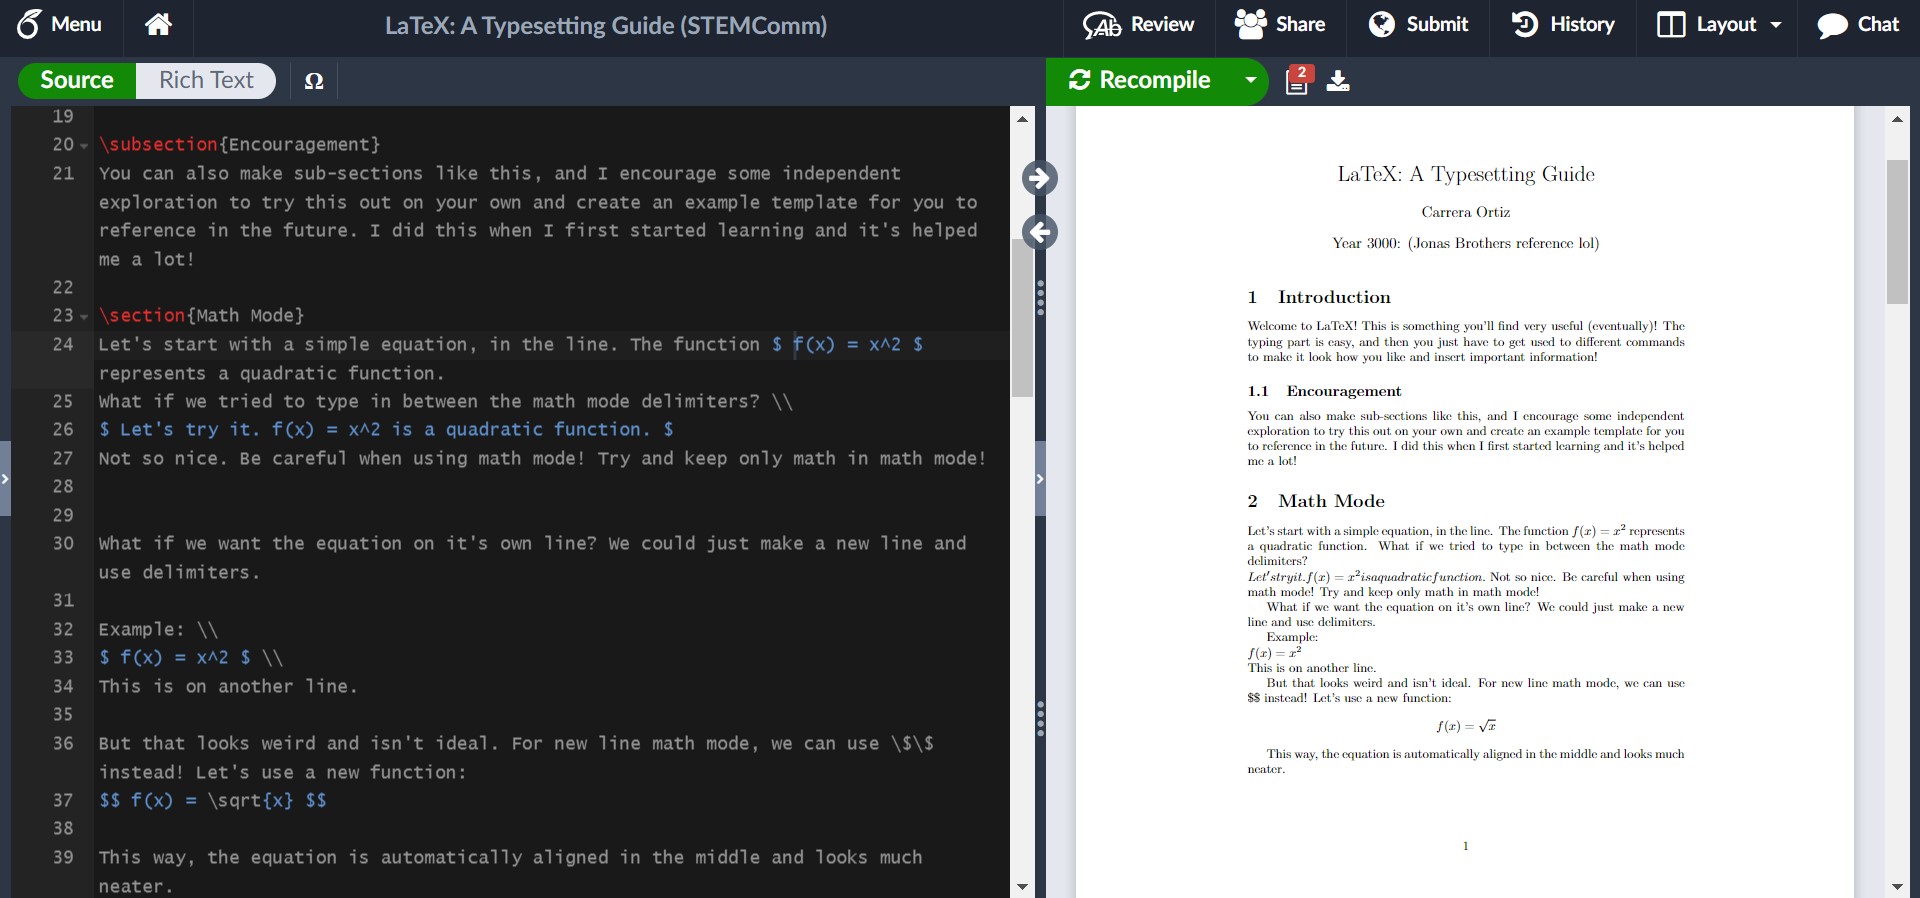
    This example shows the syntax for in-line math mode and newline math mode. For in-line math, the math is wrapped around single dollar signs on either side, such as how we had $ f(x) = x^2 $. The newline math, which is good for exemplifying results, work, or important equations that will be referenced later (something the equation environment makes easy), is wrapped around double dollar signs. In this example, we had $$ f(x) = \sqrt(x) $$.

    I hinted that the equation environment is numbered (like you’d expect to see in a textbook), but you can opt-out of this! Let’s see what this is like in LaTeX.
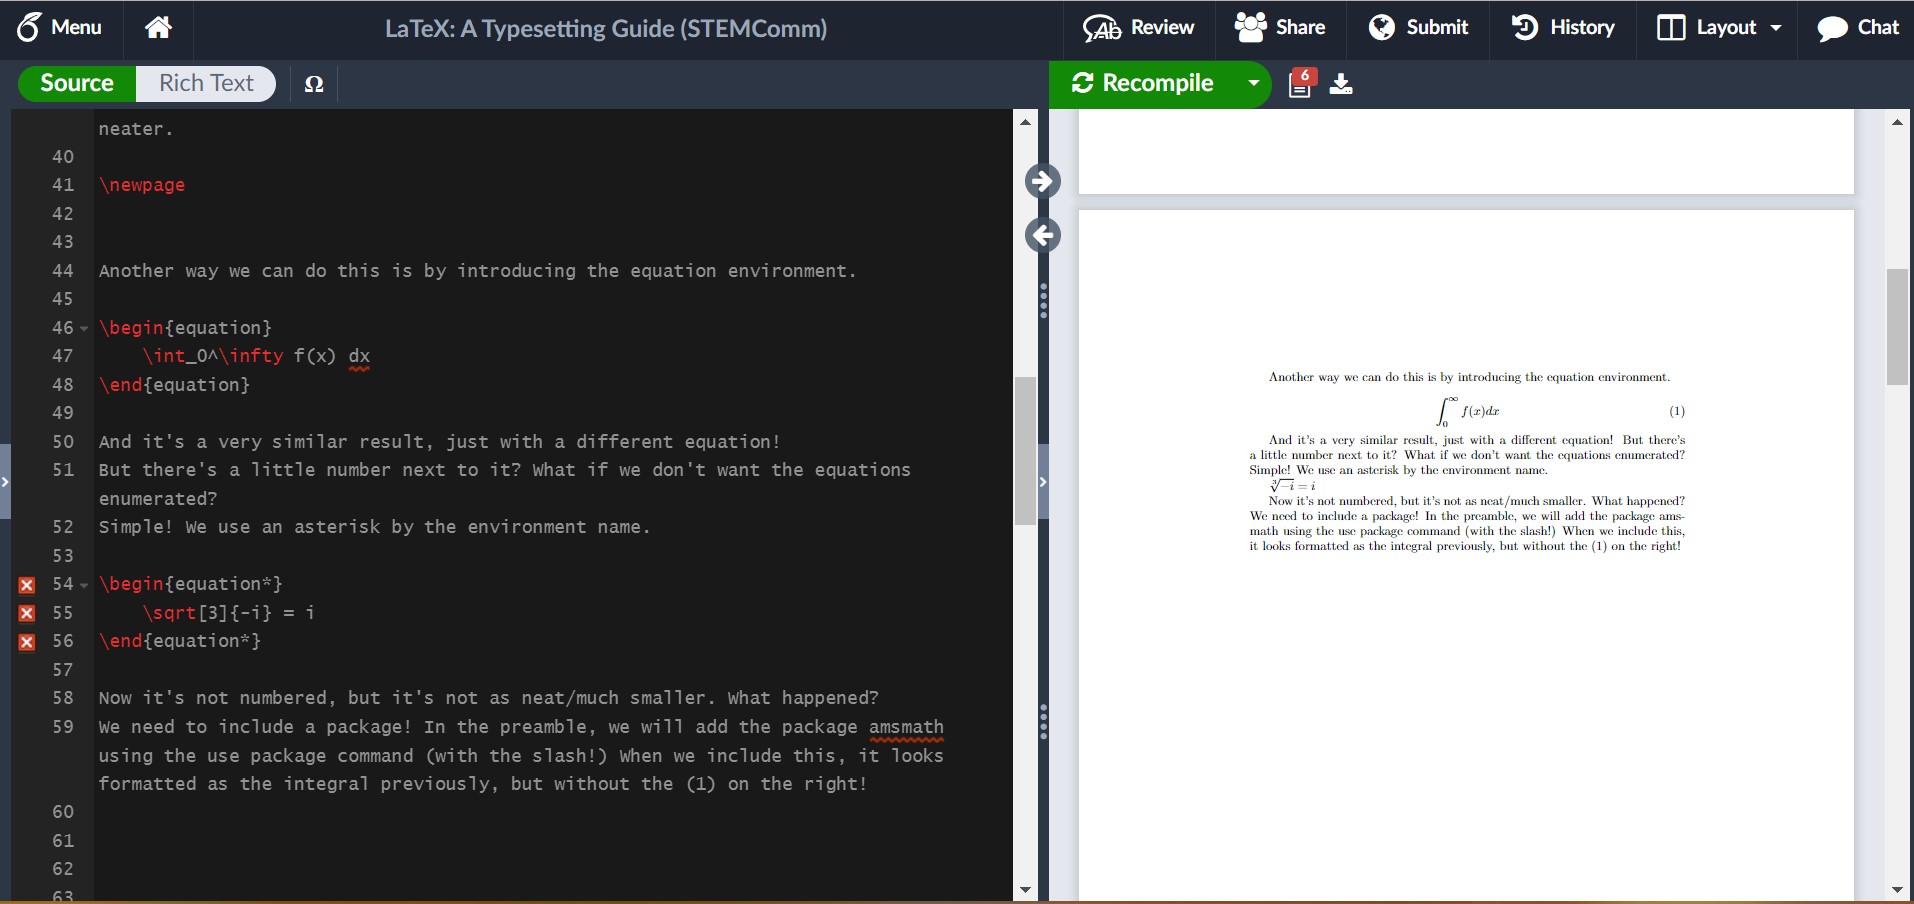
    In this example, I showed us running into an issue where we needed a package. It’s not always easy to tell what the solution is to an issue, but here, google is your friend and luckily it isn’t too hard to find! I encourage you in your own example of trying out LaTeX to include the package and see what it looks like fixed!

    For some common math symbols or uses, like exponents or square roots, it may be easy to just let it become muscle memory to do it, but for more complicated commands like for summations or limits, you can create a table for yourself to reference. (Hint: There’s luckily also another option I shall share if you wait a couple more paragraphs!)

    Another thing you may want to include in your LaTeX abilities is including images, just as I have done in this article! It’s unfortunately not as intuitive as math mode, but Overleaf does a lot of the work for you still! Images are considered figures and are formatted through the figure environment. My general suggestion is in the file outline to create a folder for your images and upload them into there! To use the figure environment, you should insert a new package called graphicx into the preamble. By converting it to the figure environment, you’re given more control over where it is and the dimensions of your image, as well as some ability to caption and reference it. If you’re uninterested in the extra help, you can simply use “\includegraphics{yourImage}”.

    To use the figure environment, you can simply type \begin{figure} and press tab, then Overleaf should finish the basics of it for you. This should look like:
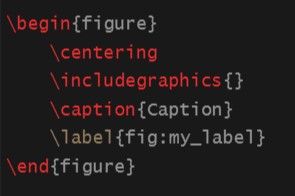
    Now, I will show you what it could look like with some editing in LaTeX!
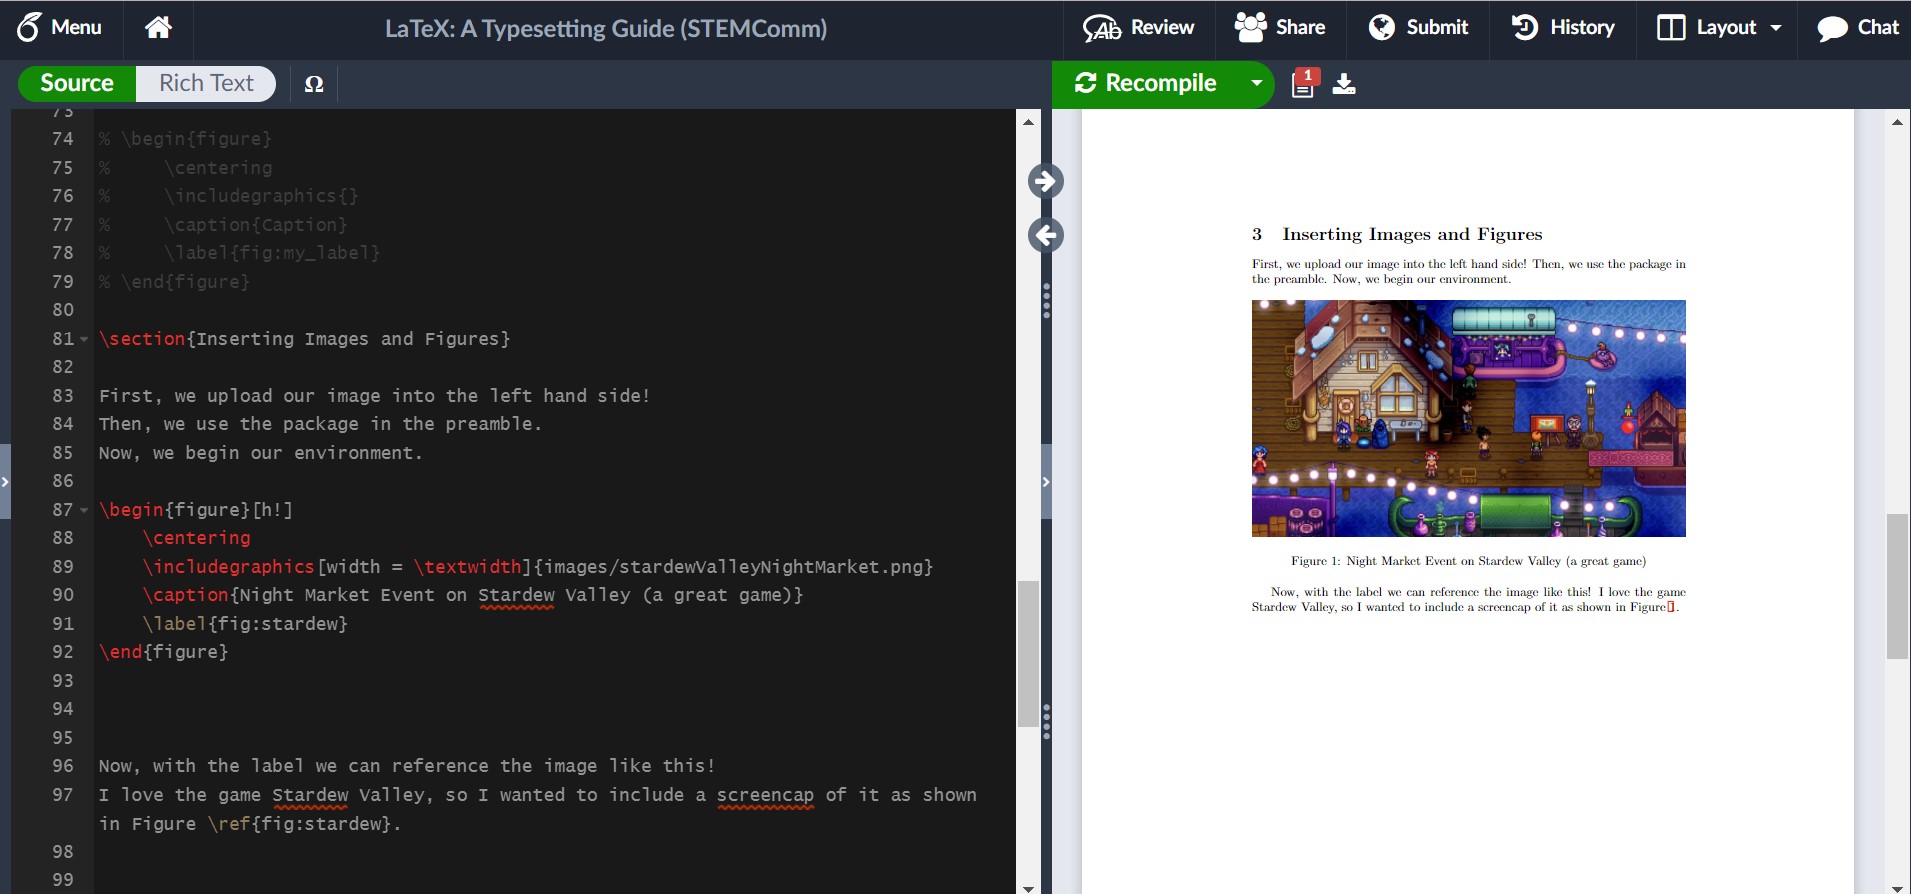
    As you can see, I included some specific edits to control how I wanted the image to look. I controlled the width, what reference I used to make it easy for myself, and where it was in the article. If you want an image on a page of its own, you can use [p!] instead of [h!] next to the begin figure environment command. Additionally, there are ways to have grids or side-by-side pictures, so its something to play around with more!

    Last instructions: Data Tables. Science is very reliant on data, so it makes sense that a lot of people interested in STEM might want to know how to include data tables in LaTeX. Expectedly, data tables have their own environment. The basics look like this:
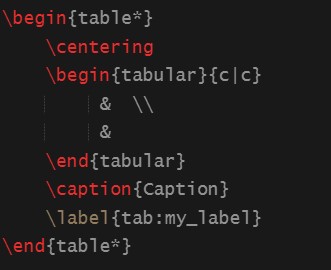
    There are some recogizable things, like the centering command and the caption and label. These work just the same as the figure environment. The tabular environment within is noticably different. The columns of the table are controlled by the {c | c} arguments. If you would like more or less columns, you can alter the amount of c’s (but be sure to include the ‘|’ delimiters). The table is actually all written in the blank area with the ampersands and new line delimiters, which you may have recognized in my previous notes on syntax. Here, you may have something like:

    Column 1 Title & Column 2 Title \\

    data row 1 col 1 & data row 1 col 2 \\

    data row 2 cold 1 & data row 2 col 2

    to showcase your data. I would experiment with this on your own! For example, you can look at the Pokedex and list some Pokemon and their types/health/attack and more to try it out! It gets a little tiring, but eventually I’ll share some nice resources to make this easier as well!

    Now, with some nice writing and composition skills, plus the ability to insert some familiar math into LaTeX, I would like to introduce some resources that will change the life of anyone who has not already figured this out. These few resources will absolutely help anyone using LaTeX to “work smarter, not harder”.

    For example, there are plenty of different symbols and functions that I might need for a paper, and it’s not always as intuitive as writing out the name of the greek symbol after the escape key (but luckily sometimes it is). This is where Detexify comes into play! There are other similar resources for equations, but I have enjoyed this one the most. Detexify allows me to draw the symbol I would like to include in my document, and not only will it show me the command for the symbol, but it will also tell me what package it belongs to and what mode it is used in. For example, if I want to indicate “there exists a real number x” symbolically, I could spend some time googling each specific thing and then write it down and hopefully remember in the future. However, through Detexify I can draw the symbols I need and find out that the symbol for a real number uses the command “\mathds{R}” in math mode through the package dsfont. I find this quicker and more helpful than just knowing the relevant command to use, and a little better than referencing a table every time! You can find this website at https://detexify.kirelabs.org/classify.html.

    Additionally, data can become very length-y very quickly and make creating data tables excrutiating. Even some small tables can take a while to set up through LaTeX without a quick way to do it. However, there’s actually a convenient website where you can set up a table for any data you would like to show in a quick and easy manner (as you might in MS Word or another similar processor), then it produces the LaTeX code that corresponds with what you’ve entered. I only wish that I had found this when I was actually taking my Advanced Lab I course and didn’t spend an hour just filling in data I had written on paper into the document. You can find this website at https://www.tablesgenerator.com/.

    Also, there is indeed a LaTeX wiki for any other things you may want to look at (including a section that goes in more detail on images).

    The irony is not lost on me that this article sharing my LaTeX knowledge is not written in LaTeX. However, when I first learned to use it, I wrote everything out in my own personal article where I experimented with all of these things and more. It was also extremely useful for me to look back on in case there was anything I knew I had done before and just needed a quick reference on how I did it and what the result looked like. I strongly encourage everyone to practice in their own article and learn something new! Maybe, after reading this article, you’ll find you also want to share some fun tidbits of information in the neatest and best way possible: LaTeX!
  • Plant-Based Savoriness: Easy as 1-2-3, MSG


    As a fourth year college student, I’ve spent a good amount of time cooking for myself and experimented with a lot of different cuisines ranging from Italian to Southeast Asian-inspired dishes. Within all of that, I’ve also tried to transition towards a more plant-based diet. Along with getting some more veggies in my meals, eating less meat can also help reduce your carbon footprint since a lot of poultry and beef farming can consume a lot of water as well as contributing to deforestation and the emission of greenhouse gasses. There’s a lot of other benefits to eating less meat, but as we all know, it definitely is hard to make that transition. The hardest part? The taste. Many of the plant-based options for meals involve replacing meat in a dish with some other protein like tofu. Although this is a great idea, tofu itself has no taste since it’s literally just processed soybeans. The solution to this issue may come from looking at our taste buds themselves. 

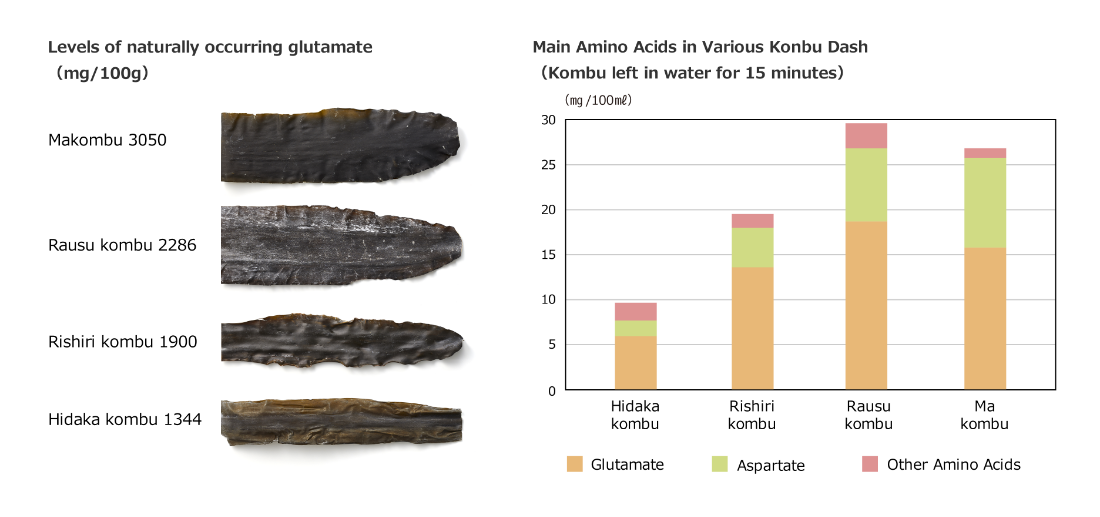
    Although the number of ‘tastes’ our tongues can perceive has been contested over the years, the most important one for our problem is umami. Umami is a flavor that Japanese researcher Kikunae Ikeda found in a type of seaweed called ‘kombu.’ He concluded that this taste was a result of the salts of glutamic acid, which is also found in meats. Glutamic acid also includes monosodium glutamate or MSG (which has no conclusive evidence proving that it’s toxic btw). Glutamates (which are the proteins made up of glutamic acid) act very similar to table salt, but instead, it enhances how our tongues perceive salt while salt brings out the flavor in our food.

    https://www.umamiinfo.com/

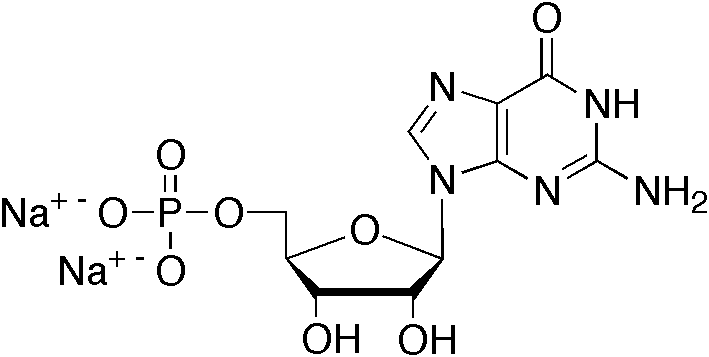
    Other chemical compounds that contribute to savoriness include the proteins inosinate (which are exclusively in meats and fish) and guanylate (which can be found in plants). This savoriness is very subtle, but its presence is still crucial to the flavor of food, just as salt makes food seem more flavorful. What foods have these compounds and are also plant-based?

    Disodium guanylate (wikepedia.com)

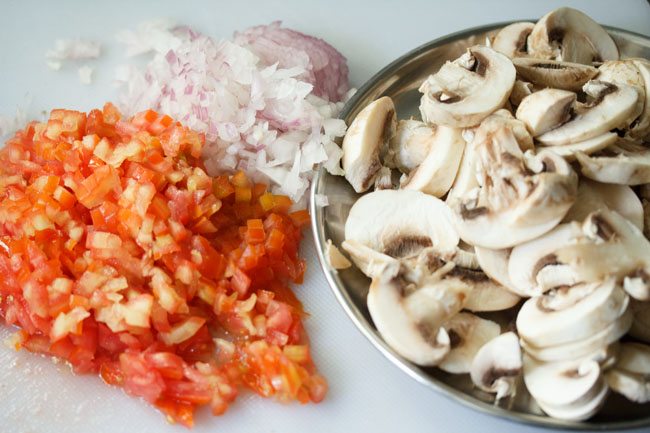
    As a person of a South Indian background, I was raised with a mostly vegan diet. Of course, I enjoy a good beef roast and chicken curry, but my favorites are the veggie dishes that my mom made since they were just as savory as the meat ones. One thing I noticed was the presence of tomatoes and onions in most of these dishes. Tomatoes (as well as mushrooms) have a high concentration of glutamate, and as we previously discussed, this contributes to the umami flavor we perceive. Onions, however, derive their flavor from sulphuric compounds– which also make us cry. When we chop onions, we break up those compounds, which are further broken down while cooking and releases more of the onion flavor and brings out its sweetness. If you’re in a pinch and can’t find a space to add these vegetables into your dish, you can also try adding MSG.

    https://www.vegrecipesofindia.com/

    Of course, switching over to a fully plant-based diet is difficult and you should take it step-by-step. Just remember that achieving savoriness from your veggies doesn’t have to be complicated and can be as easy as 1-2-3…

    Resources:

    Berry, Donna. “The Science of Savory.” Food Business News RSS, Food Business News, 11 Apr. 2016, https://www.foodbusinessnews.net/articles/6480-the-science-of-savory.

    Lang, Ariane. “Is MSG Truly Unhealthy? All You Need to Know.” Healthline, Healthline Media, 15 Nov. 2021, https://www.healthline.com/nutrition/msg-good-or-bad#what-the-research-says.

    Lisa. “Savory vs. Sweet Onions & What Makes a Great Salad.” The Cultured Cook RSS, https://theculturedcook.com/2015/09/savory-vs-sweet-onions-an-easy-crispy-salad/.

    Loria, Joe. “How Eating Less Meat Can Save the Planet.” World Animal Protection, 15 Apr. 2021, https://www.worldanimalprotection.us/blogs/how-eating-less-meat-can-save-planet.

    Nunez, Kirsten. “Types of Taste: What to Know about Taste and Flavor.” Healthline, Healthline Media, 15 May 2020, https://www.healthline.com/health/types-of-taste#umami-taste. 

  • The Science of Baking Pt.2

    Introduction

    Welcome to Part 2 of The Science of Baking! Since this is the second installment of the series, I would recommend going back and reading part 1. This article will go through an experiment of baking a flaky pastry using two different types of fat: butter and coconut oil. There are accompanying pictures that I took myself showing in detail the two pastry doughs!
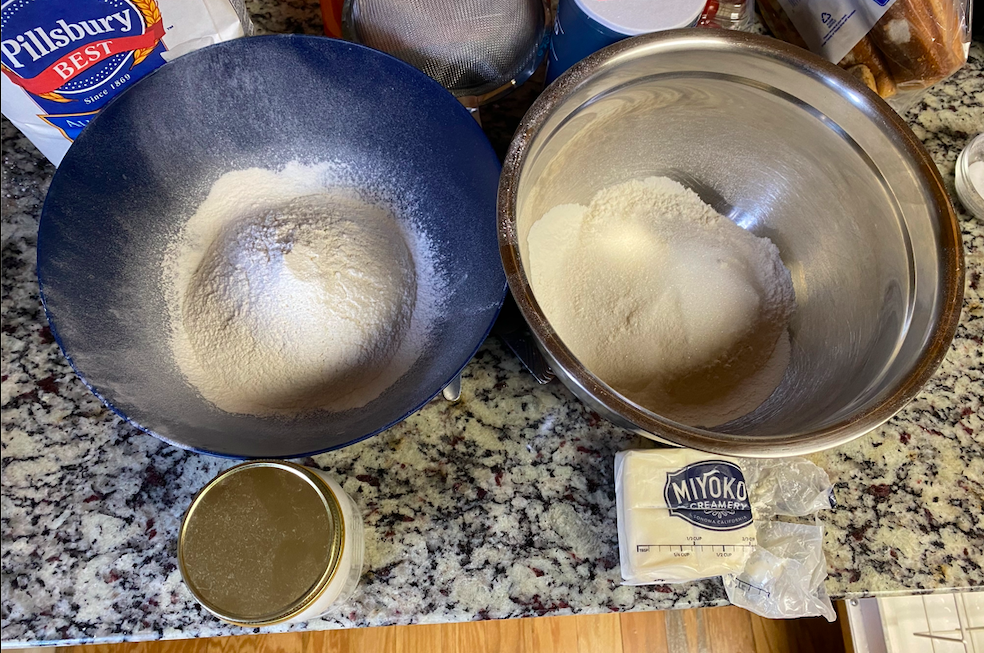
    Step 1: Mix flour, salt, and sugar.

    The two bowls of flour mix for each fat.
    The two bowls of the flour mix and the corresponding fats in front of them.

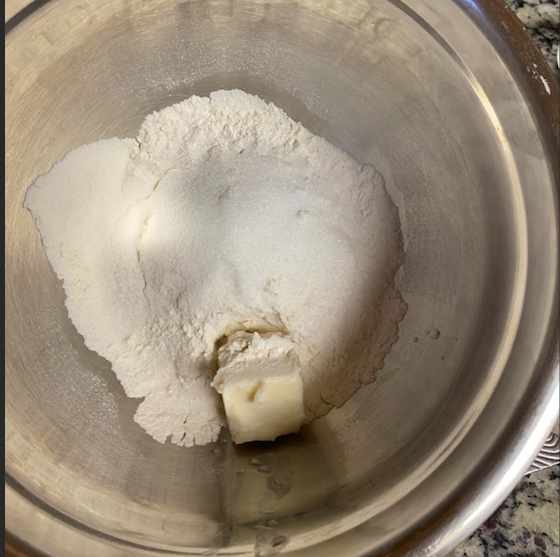
    Step 2: Break the fat up into 4 equal portions and add one portion of the fat component to flour mix.

    The butter + flour mix
    Coconut oil + flour


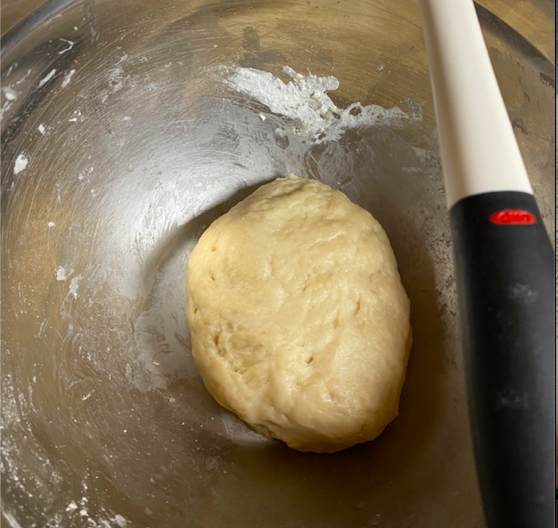
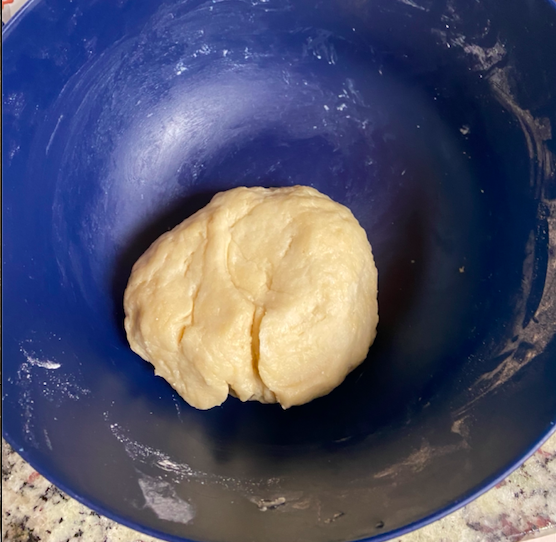
    Step 3: Mix and add water slowly until a dough forms.

    Dough with butter
    Dough with coconut oil

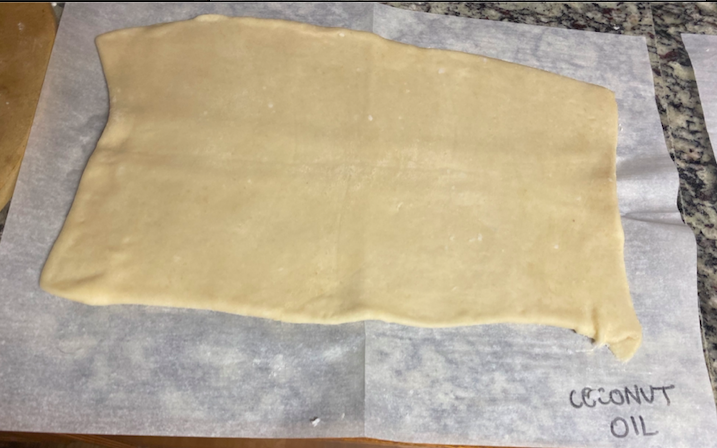
    Step 4: Roll out dough into flat sheet

    The doughs rolled out into rectangles

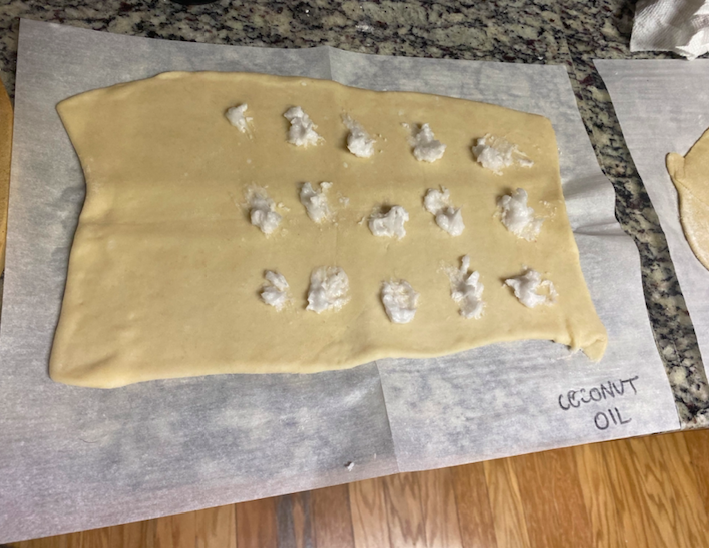
    Step 5: Break up the next portion of fat and spread along sheet of dough

    One portion coconut oil dotted on dough
    Butter dotted on dough


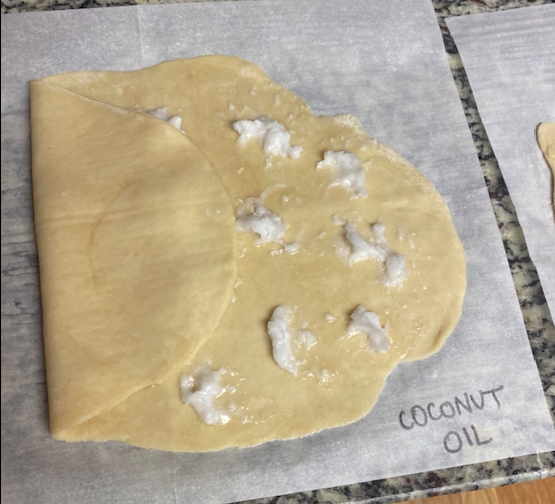
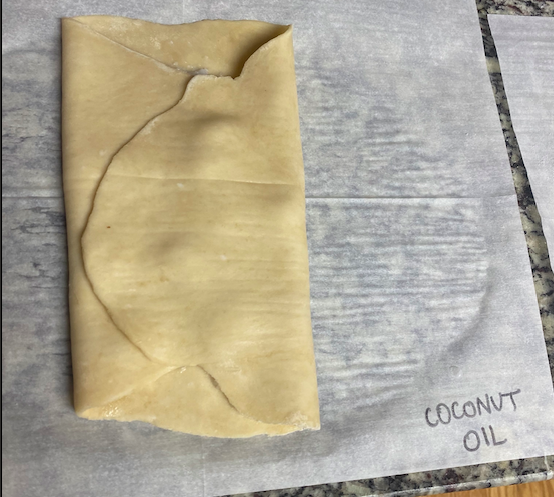
    Step 6: Fold the end without fat over 1/3 of sheet and fold the other end over the top.

    First fold
    Second and last fold

    Step 7: Roll out the dough exactly like in Step 4 carefully.

    Rolled out dough for second time

    Step 8: Repeat steps 5-7 two more times with the next two portions of fat.

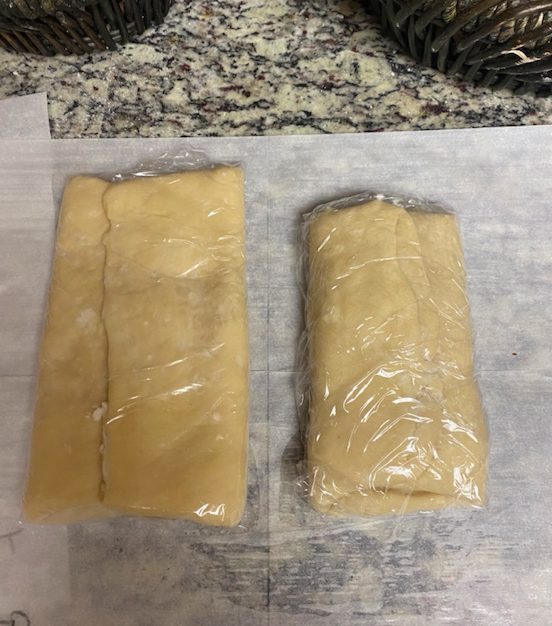
    Step 9: Wrap the dough in plastic wrap and chill in fridge for 30 minutes.

    Wrapped up and ready to go into the oven!

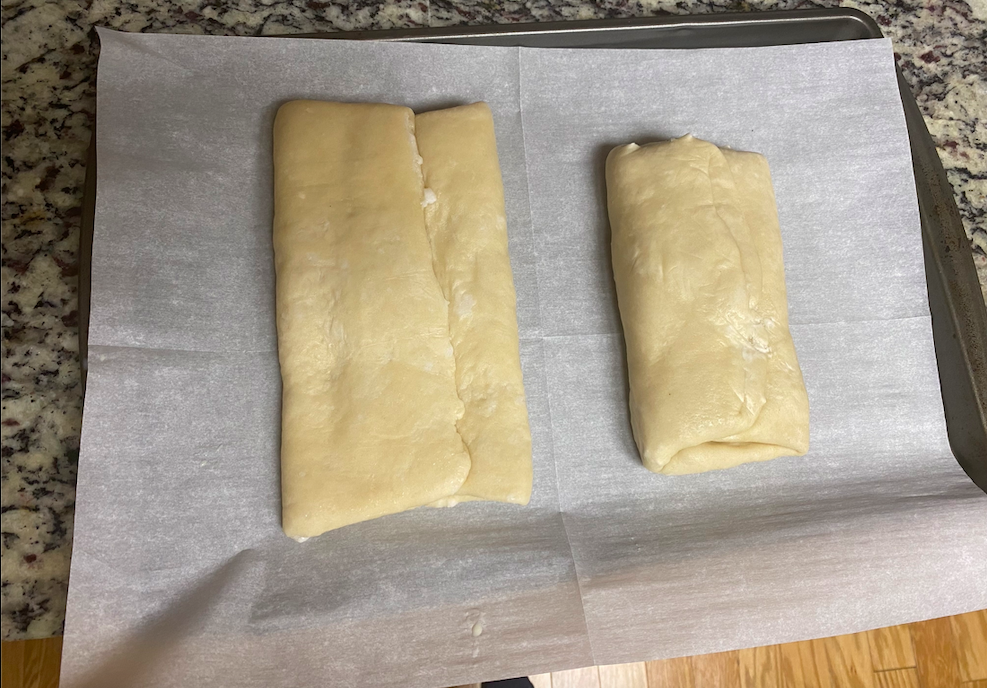
    Step 10: Preheat oven to 450° F and bake pastry for 8-10 minutes. 

    Before baking…
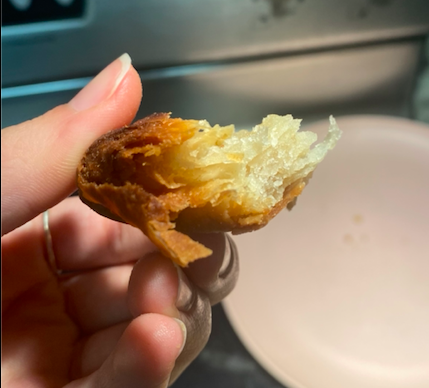
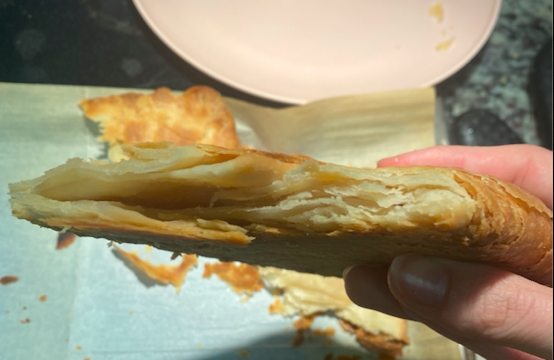
    Crispy, baked flaky pastry fresh out of the oven!


    Observations

    There were many, many differences between the butter pastry and the coconut oil pastry not only during the preparation, but after baking as well. Although coconut oil and butter have very similar structure at first glance, the butter was much creamier and incorporated into the flaky pastry dough much easier than the coconut oil. The oil melted super quickly, making it difficult to keep very doughy as it was getting way too wet. The coconut oil was also much harder to de-clump while the butter of course, had real clumps. Another huge difference between the doughs was their size. As seen from the photos, the coconut oil dough had a much larger size than the butter dough. My theory for this stark difference was that the butter was much thicker than the coconut oil, making the dough much more cohesive and elastic. The coconut oil pastry was clearer flatter and more spread out, due to the silky nature of the coconut oil. The butter pastry was also much taller than the flat coconut oil version; my thinking tells me the butter allowed for the pastry to rise better than the oil did.

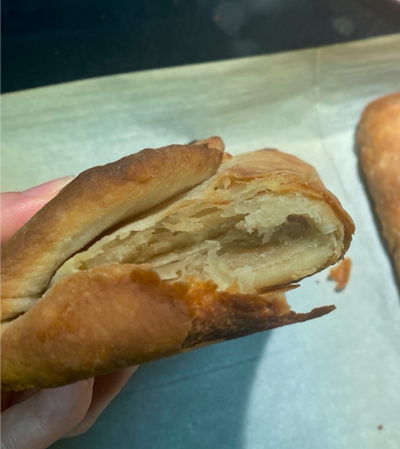
    In terms of taste, texture, and overall flakiness, both doughs performed relatively well but the butter dough definitely outshone the coconut oil. Though the butter dough was better in taste and more compact, the coconut oil pastry was also quite delicious as a substitute for butter. For any coconut lover, this is the perfect pastry substitution for fat. All in all, both doughs baked into beautiful flaky pastries with multiple light layers of crisp pastry, but the dough using the butter cooked better and tasted more like a pastry would normally taste.

    The dough with butter and its nice flaky layers
    Buttery, flaky layers of delicious pastry


    The flatter layers of the coconut oil pastry
    The coconut oil flaky pastry result


    Conclusion

    This experiment was so much fun to do considering I love to bake and have never made a flaky pastry dough before! I learned so much from the experience- not just how to make a flaky pastry but also so much new insight on how the science of baking really works together to create a magnificent dessert when heat is introduced to a couple of different ingredients. I encourage anyone reading this post who enjoys baking to try this experiment out for yourself to see if your results are the same! Not only did this experiment make me want to bake even more, but now I have an urge to try this recipe with all possible substitutes for fat like ghee, vegetable shortening, even lard. The possibilities are endless and we are just getting started!

  • Color Changing Lemonade

    Would you believe the drink above is lemonade, and the blue and purple colors are due to all natural ingredients? That’s right. The lemonade pictured is cooled with not-so-average ice cubes. These cubes are made from frozen butterfly pea flower tea. 

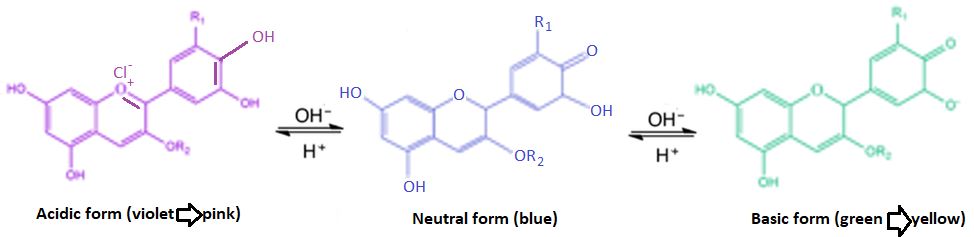
    Butterfly Pea flower tea is a popular non-caffeinated tea from Southeast Asia. It is made simply by steeping butterfly pea flowers in boiling water. Butterfly pea flowers get their deep blue hue from a natural compound called anthocyanin. This compound is the reason for the dark blue color of the ice cubes in the video above, and is also the reason for the amazing color change that occurs when the ice cubes come in contact with the acid from the lemon juice.

    Anthocyanin undergoes reversible chemical changes (shown above) when exposed to either acids or bases. The chemical change alters the chemical structure, which alters the way it absorbs different wavelengths of light. When anthocyanin is exposed to a base, it reflects green and then yellow, depending on the strength of the base. When anthocyanin is exposed to acid, it turns purple and then red, depending on the strength of the acid. Because lemons are acidic, the melted butterfly tea ice cubes turn purple!

    You can make this cool color changing drink at home with butterfly pea flowers and other normal household ingredients.

    Making the butterfly pea flower ice cubes is simple. Just steep about 4 to 5 butterfly pea flower tea bags, or 25 to 30 dried pea flowers, in about 2.5 cups of boiling water. You can choose to leave the teabags/flowers steeping for up to 30 minutes for concentrated color, but just 10 minutes will get you blue ice cubes that can definitely give you a beautiful color change.

    All that’s left is to make the lemon mix that will turn the ice cubes purple! Mix 1 cup of lemon juice with ¾ cups of sugar and stir until the sugar is completely dissolved. You can heat up the mixture a little to speed the mixing process.

    Next, take your frozen butterfly pea flower tea and put it in the blender or food processor to create shaved ice. If your blender is like mine and can only make crushed ice pieces, that’s okay, just make sure there is some melted tea in your glass to get the immediate color change effect. Fill your glass halfway with crushed or shaved butterfly pea flower ice, and then add the lemon mix! As the anthocyanin comes in contact with the acid from the lemon juice, it will turn a pretty purple color. If you have some bigger crushed butterfly pea flower ice pieces, they will stay blue and only turn purple as they melt, which will create a swirly blue/purple gradient effect. Fill the glass with your desired amount of lemon mix (I fill it about ⅓ full) and top the rest of the glass with club soda! And viola, you have your color changing lemonade!

    Citations

    Kodippili, D. (2020). Color Changing Lemonade Slushie (Galaxy Lemonade). The Flavor Bender. www.theflavorbender.com/galaxy-color-changing-lemonade-slushie/

    Kan, Viirj & Vargo, Emma & Machover, Noa & Ishii, Hiroshi & Pan, Serena & Chen, Weixuan & Kakehi, Yasuaki. (2016). Organic Primitives: Synthesis and Design of pH-Reactive Materials using Molecular I/O for Sensing, Actuation, and Interaction. 


  • The Alien Equation

    Throughout history, humanity’s view of the universe has changed drastically. For a long time, people believed that the Earth was all there was, with a dome high above it that had pinpricks they called stars. Later, they believed the solar system was the extent of the universe. Then that view expanded to the galaxy as we realized the pinpricks were actually other suns. Now, we believe there is a universe beyond even what we can observe, with other galaxies than our own populating space. When our understanding of the universe allowed us to understand that other stars exist, there began to be questions of extraterrestrial life around other stars and whether we on earth could somehow communicate with it. In the 1960’s, a man named Frank Drake wrote a book exploring the chances of life on other planets that was intelligent and capable of communicating with Earth in our galaxy. The book lead to an equation that expresses this chance numerically:

    N = R * f(g) * f(p) * n(e) * f(l) * f(i) * f(c) * L

    This equation has many terms that are not able to be calculated exactly, but they do lay extremely good groundwork for an estimate of intelligent, communicative life. This equation got experts talking about what they thought the odds for life in the universe could be and helped encourage the search for extraterrestrial life. This equation is also really easy to use to develop your own guess on the chances of extraterrestrial life. Breaking down this equation, there are three categories the values can be put into based on what factors they relate to. 


    Astronomically Based Values

    The first three values in the equation are values that are gained from observing the galaxy. They are astrophysical values that, with our current scientific capabilities, are reasonable to calculate somewhat accurately. The first value, R, is the rate of star formation in the galaxy. It can alternatively be the number of stars estimated to be in the galaxy. It is the starting point of the equation, as most of the other terms are fractions that whittle this value smaller and smaller as the criteria gets more specific. The current estimate of stars in the galaxy is between 100 and 400 billion stars. The second value, f(g), is an estimate of how many stars in the galaxy are suitable for hosting planets with life. Stars that can host planets with life must be long living and steady stars and they cannot have large fluctuations in temperatures and intensity. This value is currently estimated to be between 5 and 10 percent, meaning .05 to .1 for use in the equation The third value, f(p), is a measure of how many of those suitable stars actually have planetary systems. For example, stars that are in binary systems are thought to very rarely host planetary systems. This value is often estimated at about .5, as about 50% of star systems are binaries or multistar systems and the other 50% are single stars. 


    Biologically Based Values

    The next three values of the Drake equation are based on biological factors with life. The first one, n(e), is how many planets per star system are suitable for life. This mainly means how many planets are in the habitable zone of a star. The habitable zone is the distance from a star where planets can have water in all three phases, solid, liquid, and gas. The value to plug into the question can be found by taking your estimate of the number of planets in the habitable zone and dividing it by the estimated total number of planets in the system. For a system like our solar system, this would be .125. The next value, f(l), is the fraction of planets in the habitable zone that will actually have life form. This is where the values in the equation begin to vary greatly from person to person. Some people argue that if life can form it will and put this value at 1. Others argue that life is extremely rare to happen, putting the value closer to .001, or even smaller. Since we have so little understanding of how life started on Earth, it is hard to estimate its rarity in other places.  The final value, f(i), is the fraction of cases in which life develops intelligence. Once again, this is a controversial value to choose. Currently, we don’t know if life always evolves to intelligence. It can be argued that we did, so why wouldn’t other planets? However there have also been millions of species on our planet, and only one has evolved to our level of intelligence: humans. With those odds, intelligence seems rare. 


    Sociological Based Values

    The last two values of the Drake equation are sociological factors. The first one, f(c), is the number of intelligent races that have the technological capability and desire to try and communicate with other species. An example of this coming into play may be with an intelligent species that lives underwater. It would be difficult, if not impossible, for them to invent electronic devices like ours, and things like radio telescopes to communicate with might never be designed by them. Experts tend to estimate this as a fairly large value because it is thought by many that upon developing intelligence, a species will continually improve their technology. This is believed to always lead to communication technology in the process. The exception to this are species that face rare environmental factors that dissuade the invention of specific types of technologies, such as the underwater species example. The last value, L, is the lifetime of a civilization. This is as simple as it sounds. This value is necessary because we live so far from other planets that it would take a very long time to communicate with them. The very long time it takes to send a message means there needs to be long standing civilizations to continue any conversations, otherwise they would not be able to truly communicate with us. This value is often estimated to be between 1,000 and 100,000,000 years. 


    Concluding Thoughts

    Current estimates of the value calculated from the Drake equation range from as low as .00000000000091 to 15,600,000 planets that host intelligent, communicative life. The value can be much larger or lower than this as well, but there is no “correct” answer. You can find your own solution by plugging in values that you think are true. All you have to do is start with the number of stars in the galaxy and fill in what fractions you believe fit for the other values, and choose a lifetime to use. If your answer is greater than 1, your chosen parameters suggest that life exists elsewhere in our galaxy. However, if your answer is less than 1, your parameters suggest that we are likely alone in the galaxy. As long as you can give a reason for the values you chose, you have created your own theory for life in the universe.


    Burchell, M. (2006). W(h)ither the Drake equation? International Journal of Astrobiology, 5(3), 243-250. doi:10.1017/S1473550406003107

    Drake, F.; Sobel, D. (1992). Is Anyone Out There? The Scientific Search for Extraterrestrial Intelligence. Delta. pp. 55–62. ISBN 0-385-31122-2.

  • A Cosmological Experiment

    This is an experiment that you can do yourself to learn a bit about how scientists think the universe became as large as it is. All you will need is a balloon and a marker. Alternatively, you can treat it as a thought experiment!

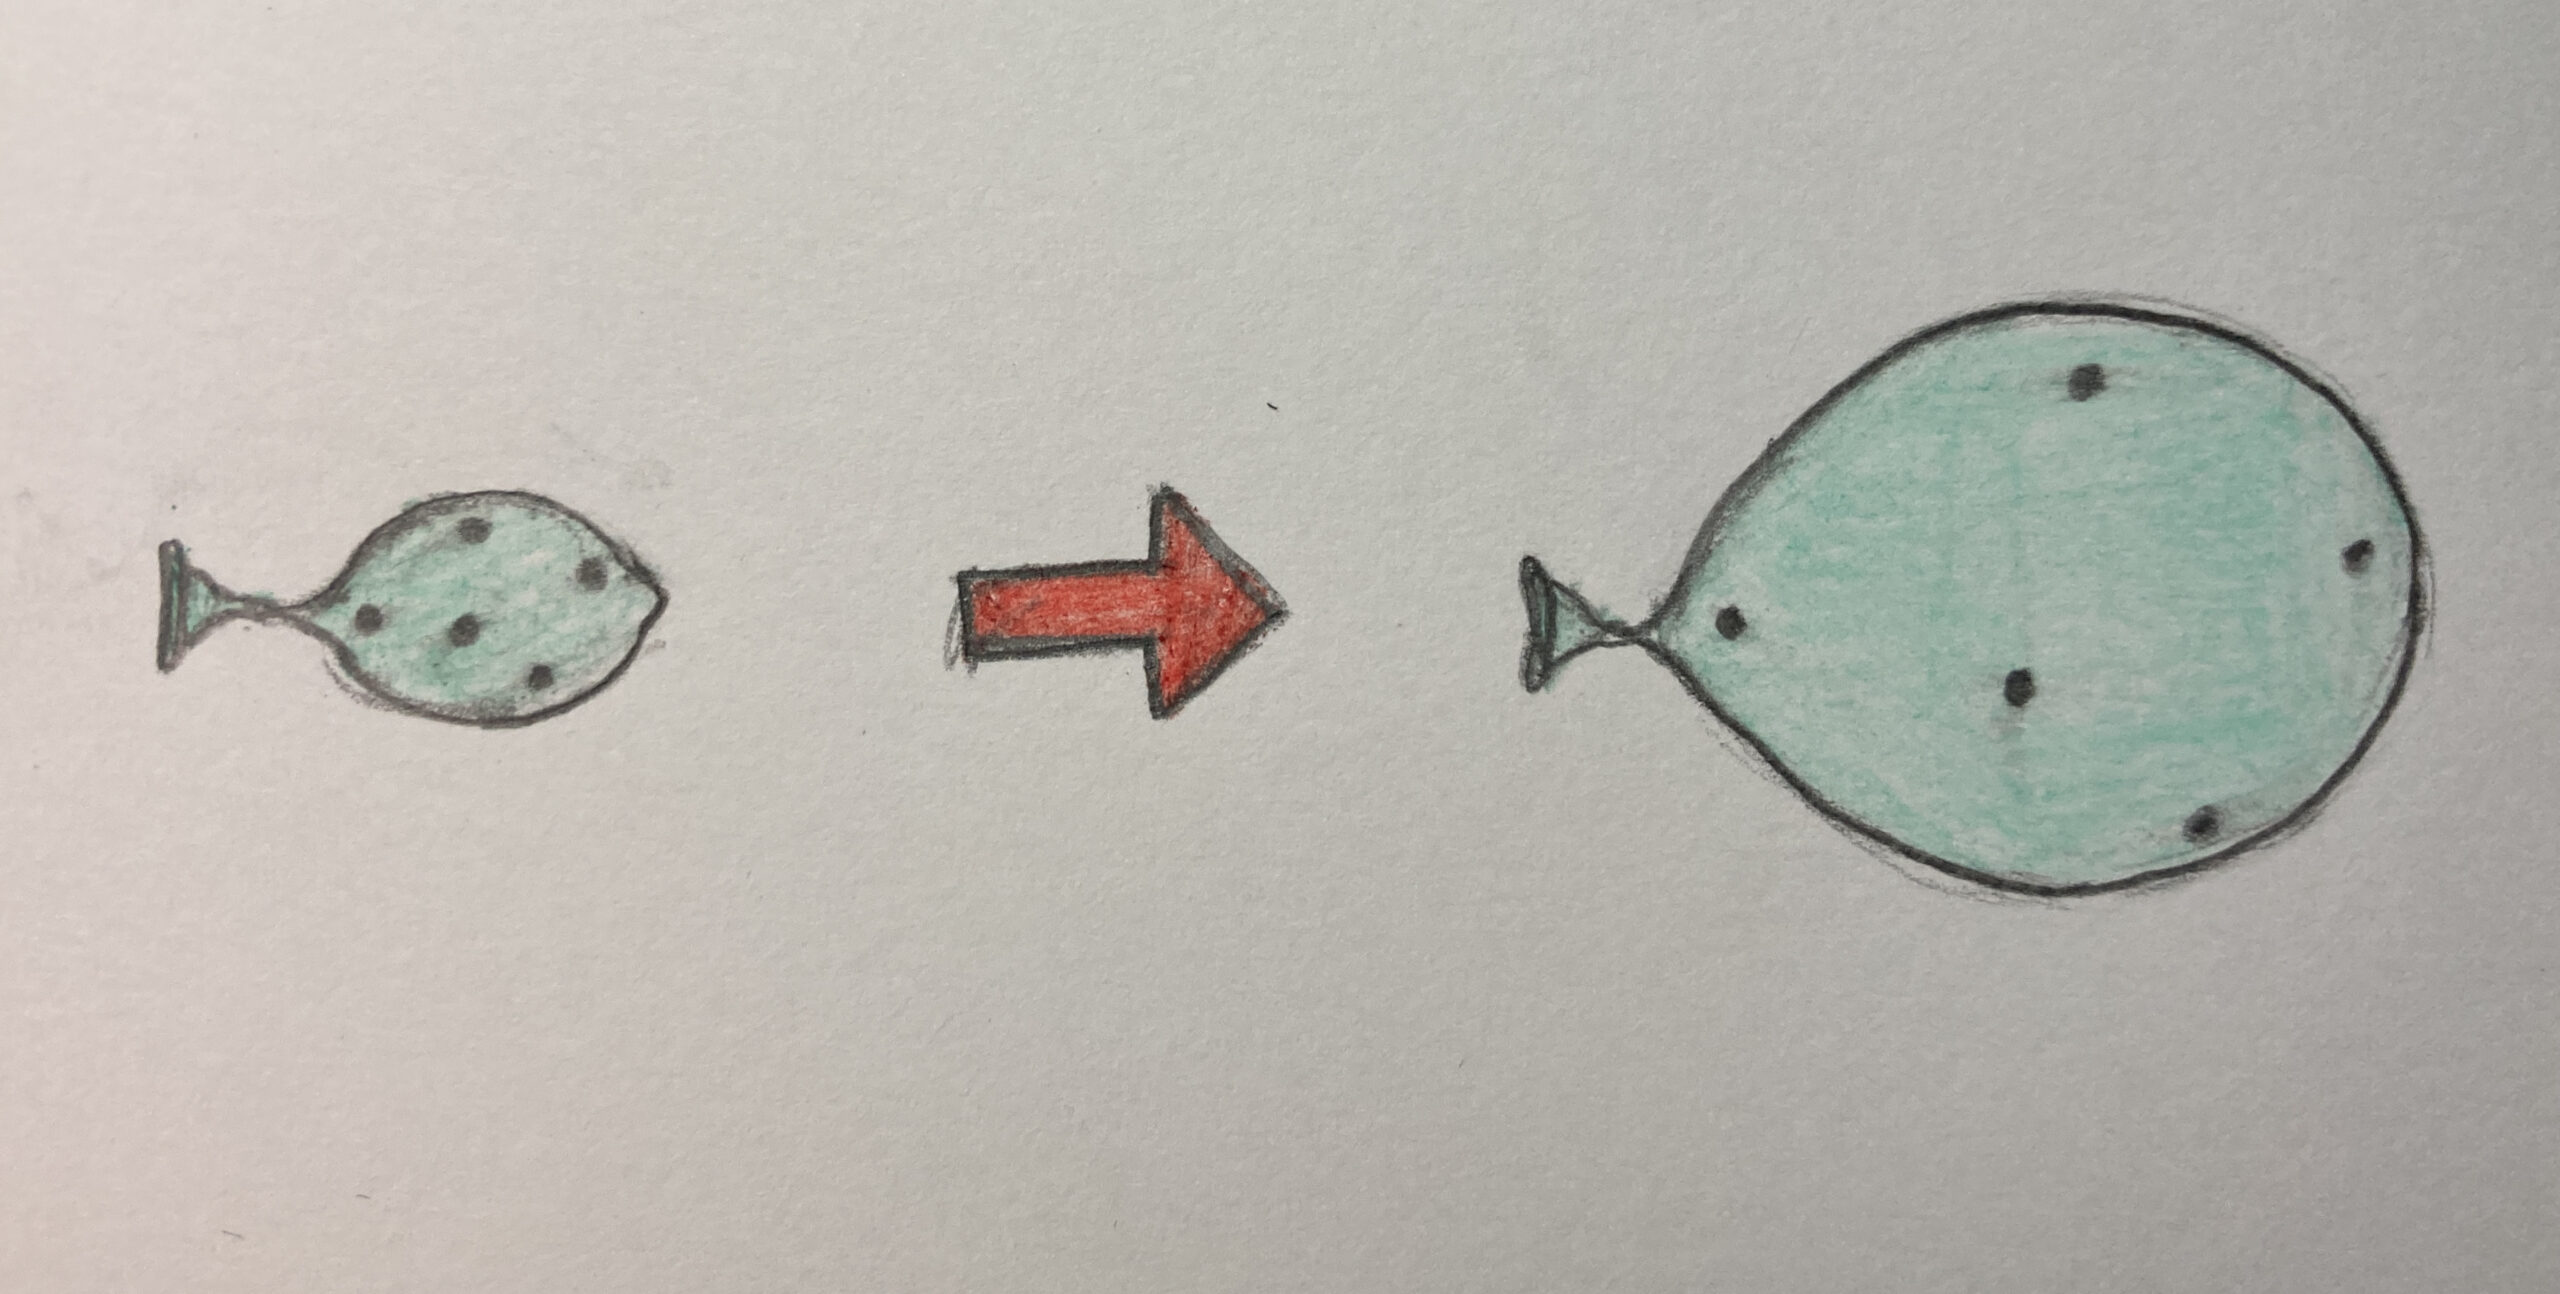
    The first step is to take your balloon and blow it up just so it holds a circular shape and then block the air off. This balloon is going to represent spacetime. Spacetime is what matter resides on. Using a marker, draw some dots on your balloon. This is our matter. 

    All together, this balloon and the dots are going to represent the very early universe. When the universe was very young, it was still condensed very close together. Matter was moving away from each other, but it could not travel faster than the speed of light. What this would imply to our universe today is that the amount of the universe we can see, is all there is to see. But scientists don’t believe that this is true. Instead, they think spacetime shows us a different way of getting a large universe. 

    Partially blown up balloon vs fully blown up balloon.

    Take note of the distance between the dots on your balloon. Maybe pick out two favorites to measure specifically, then blow up your balloon as much as you can. Observe the distances between your dots now. They are much farther away than they were before, right? Take a close look at the dots though, they have not moved from their original position on the balloon. The balloon itself has expanded, but the dots stayed in one place. This shows your matter’s position on spacetime has not moved, but rather spacetime itself has expanded. 

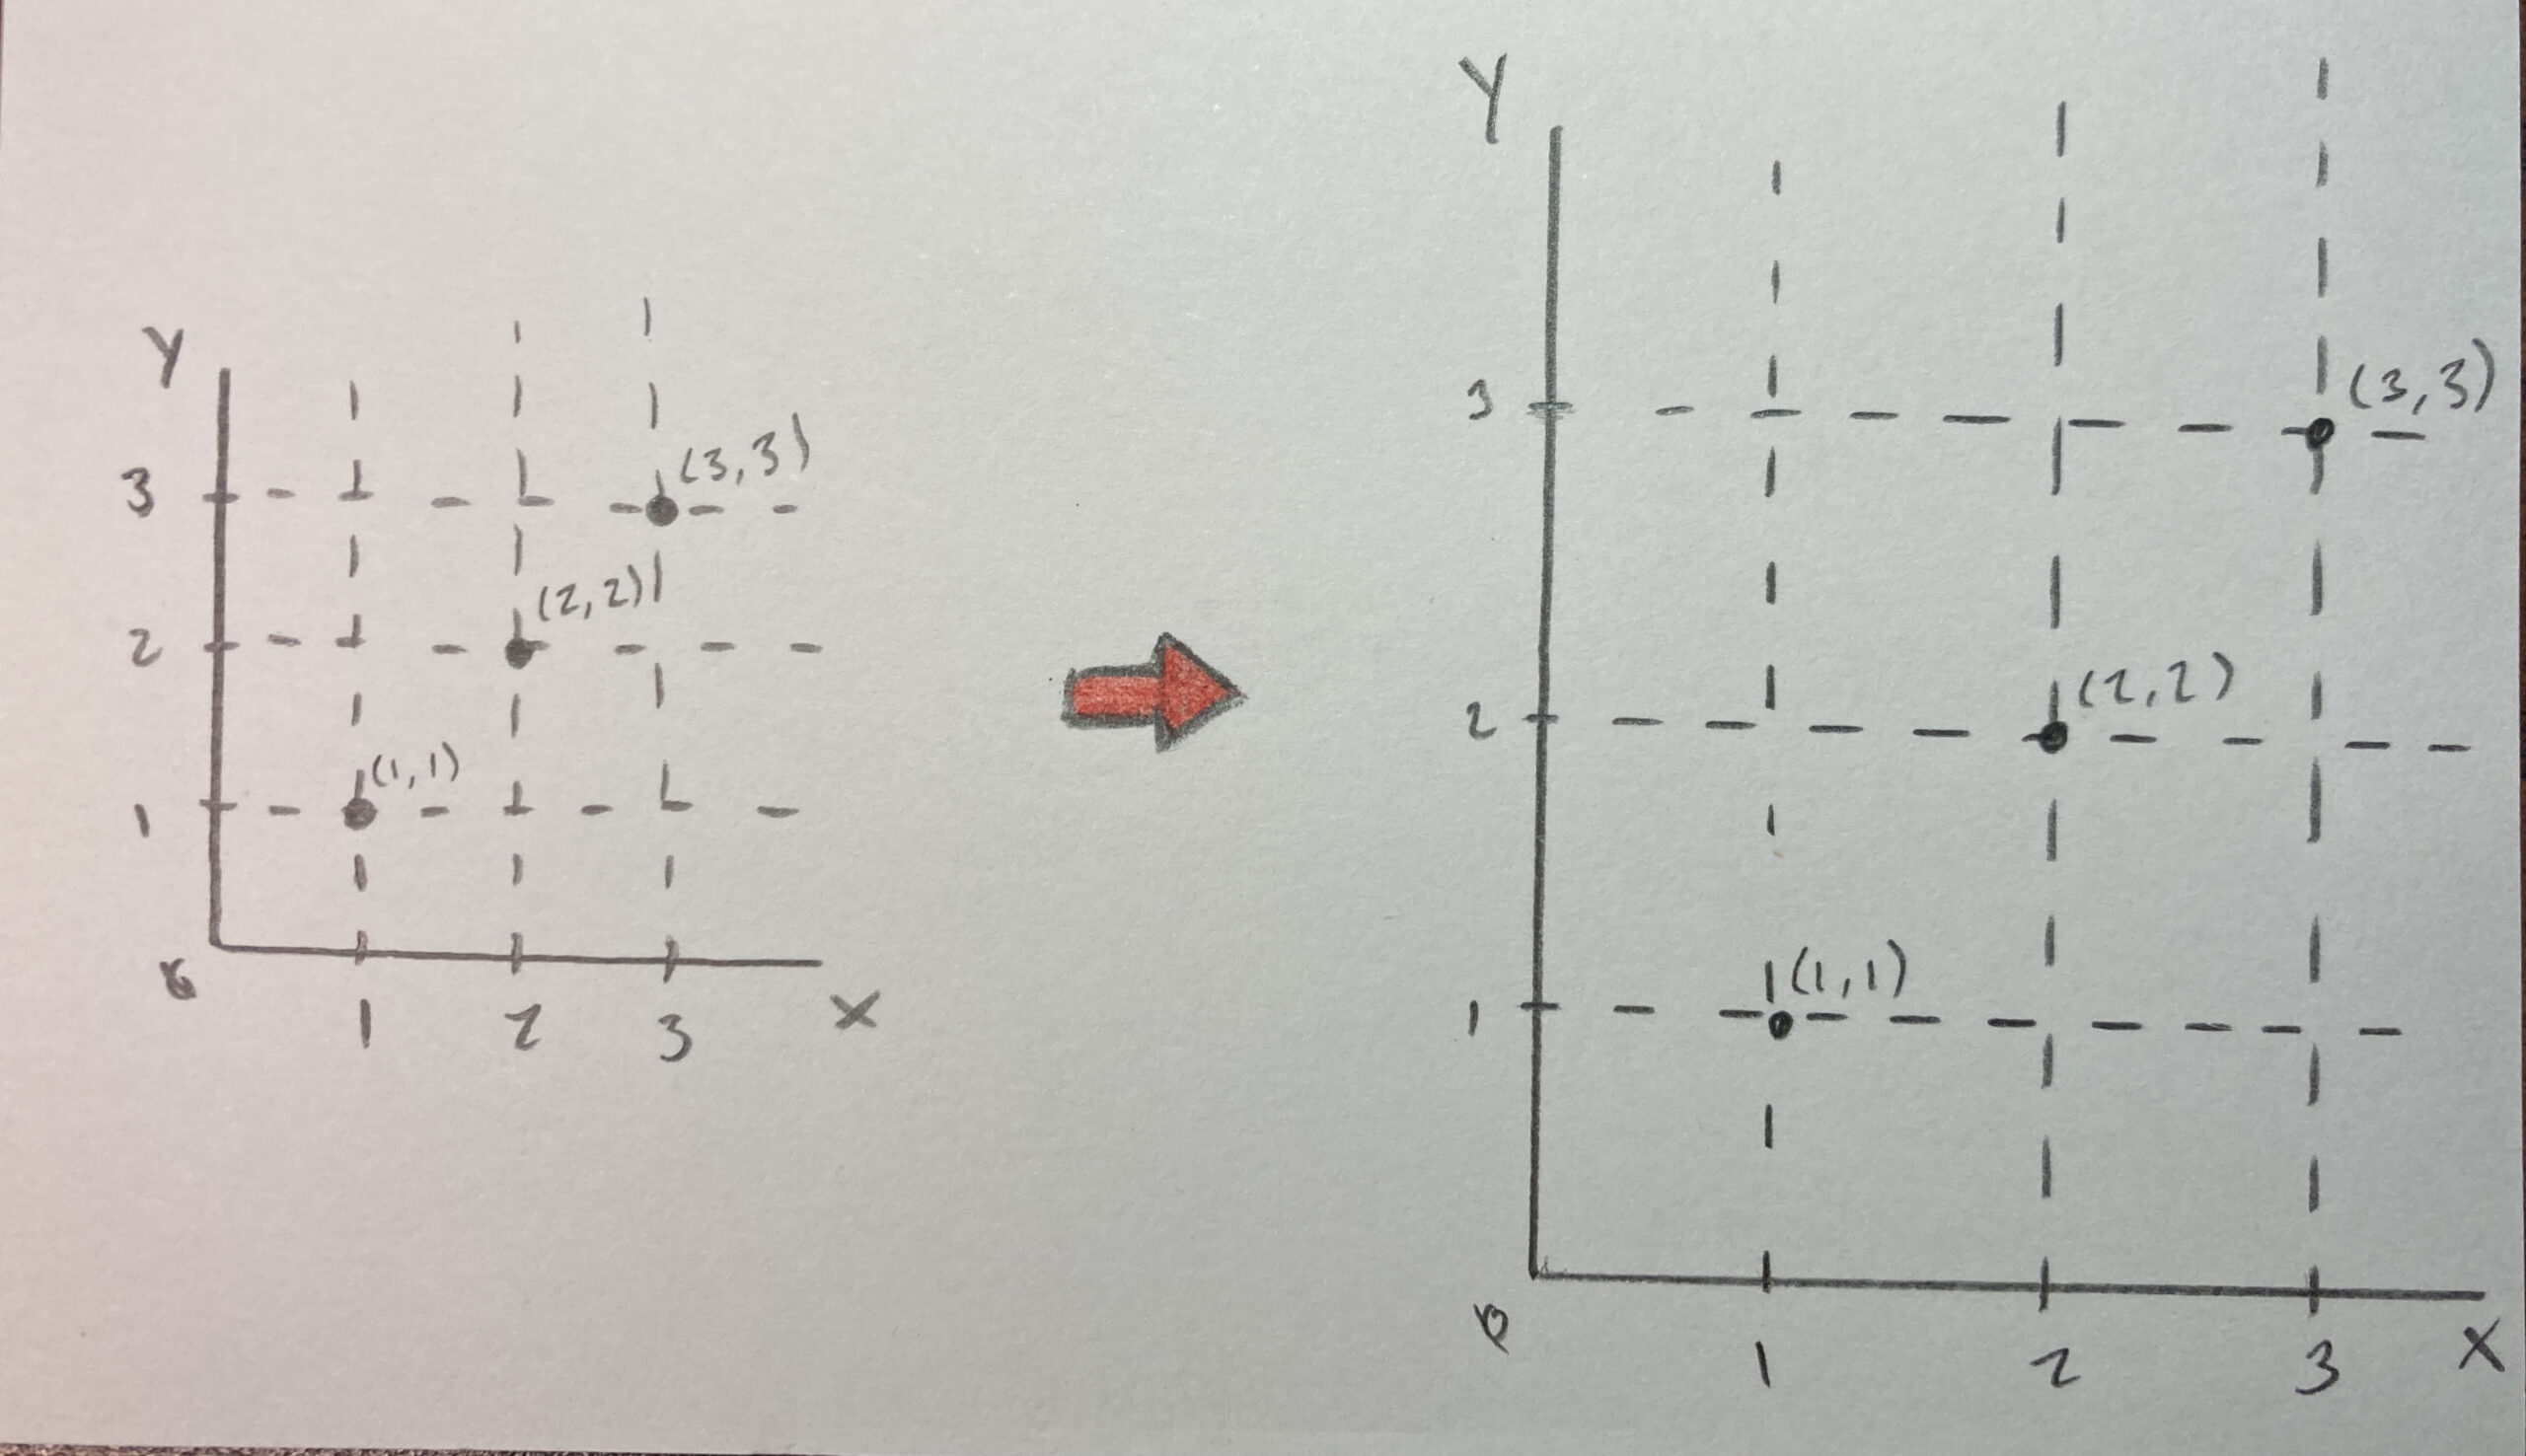
    This stretching of the balloon that leaves the dots in the same position is a simple way to visualize what cosmologists call the “Inflationary Theory”. This is a theory for how the universe was formed. It says that after the initial Big Bang at the beginning of time, there was a very short amount of time in which spacetime inflated to be much much larger than it was to start. Since spacetime is not matter, it can move faster than light without breaking any laws of physics. This made the matter end up far from other matter, but still technically in the same position on spacetime. Think of spacetime as a coordinate grid and matter is on it. This inflation caused the space between the grid lines to get larger, but the matter didn’t move from its position on the grid. 

    The expansion of spacetime modeled as a coordinate grid.

    What this means for us now ultimately is that the universe is much larger than what we can see on Earth. This is why we differentiate between the observable universe and the entire universe. The observable universe has a radius that correlates with the age of the universe. This is because light has been traveling constantly since the beginning of time so the farthest light we can see took the entire universe’s lifetime to reach us. Outside of the observable universe though, there is more of the universe that we can’t see, caused by this early inflation of spacetime when the universe was created. 


    Sowell, James. (2021). Early Universe [Powerpoint Slides]. Retrieved from Georgia Institute of Technology PHYS 2022 Canvas site.

    Tsujikawa, S. (2003). Introductory review of cosmic inflation. arXiv preprint hep-ph/0304257.

  • How much do you know about RSA Cryptography?

    Whether you’re browsing TikTok, Instagram, or scrolling through random Wikipedia articles, do you ever wonder if your internet browsing is secure? Probably not – but that’s okay! The world can peacefully rely on the wonders of mathematics to keep their data and internet browsing safe from peeking eyes. In fact, the entire safety of the internet primarily relies on a single mathematical algorithm to secure it all, ranging from state secrets in secret government databases – which are probably all about UFOs – to your grandmother’s email account. This algorithm was first developed in 1977; it’s so powerful that it still remains the primary public cryptographic algorithm today! It’s called the Rivest-Shamir-Adleman (RSA) cryptosystem.

    Background

    Developed in 1977 from a paper released by Ron Rivest, Adi Shamir, and Leonard Adleman, while they were at the Massachusetts Institute of Technology, RSA quickly became adapted to securing digital communication because of its robust mathematical properties that makes it virtually impossible to break.

    Interestingly, the actual mathematics behind the RSA cryptosystem is rather simple. It’s based on the idea of prime factorization – it’s really easy to find the prime factors for a small number but becomes much harder as the numbers grow. For example, if I ask you to give me the two prime factors that multiply together to give the number 15, you would probably answer really quickly with “3 and 5”. Easy, right? Now, without a calculator, what if I asked you to give me the prime factorization for the number 414,863? You would answer with “577 and 719” right away, right? Unless you’re a super math genius or a human calculator, probably not.

    Implementation Idea

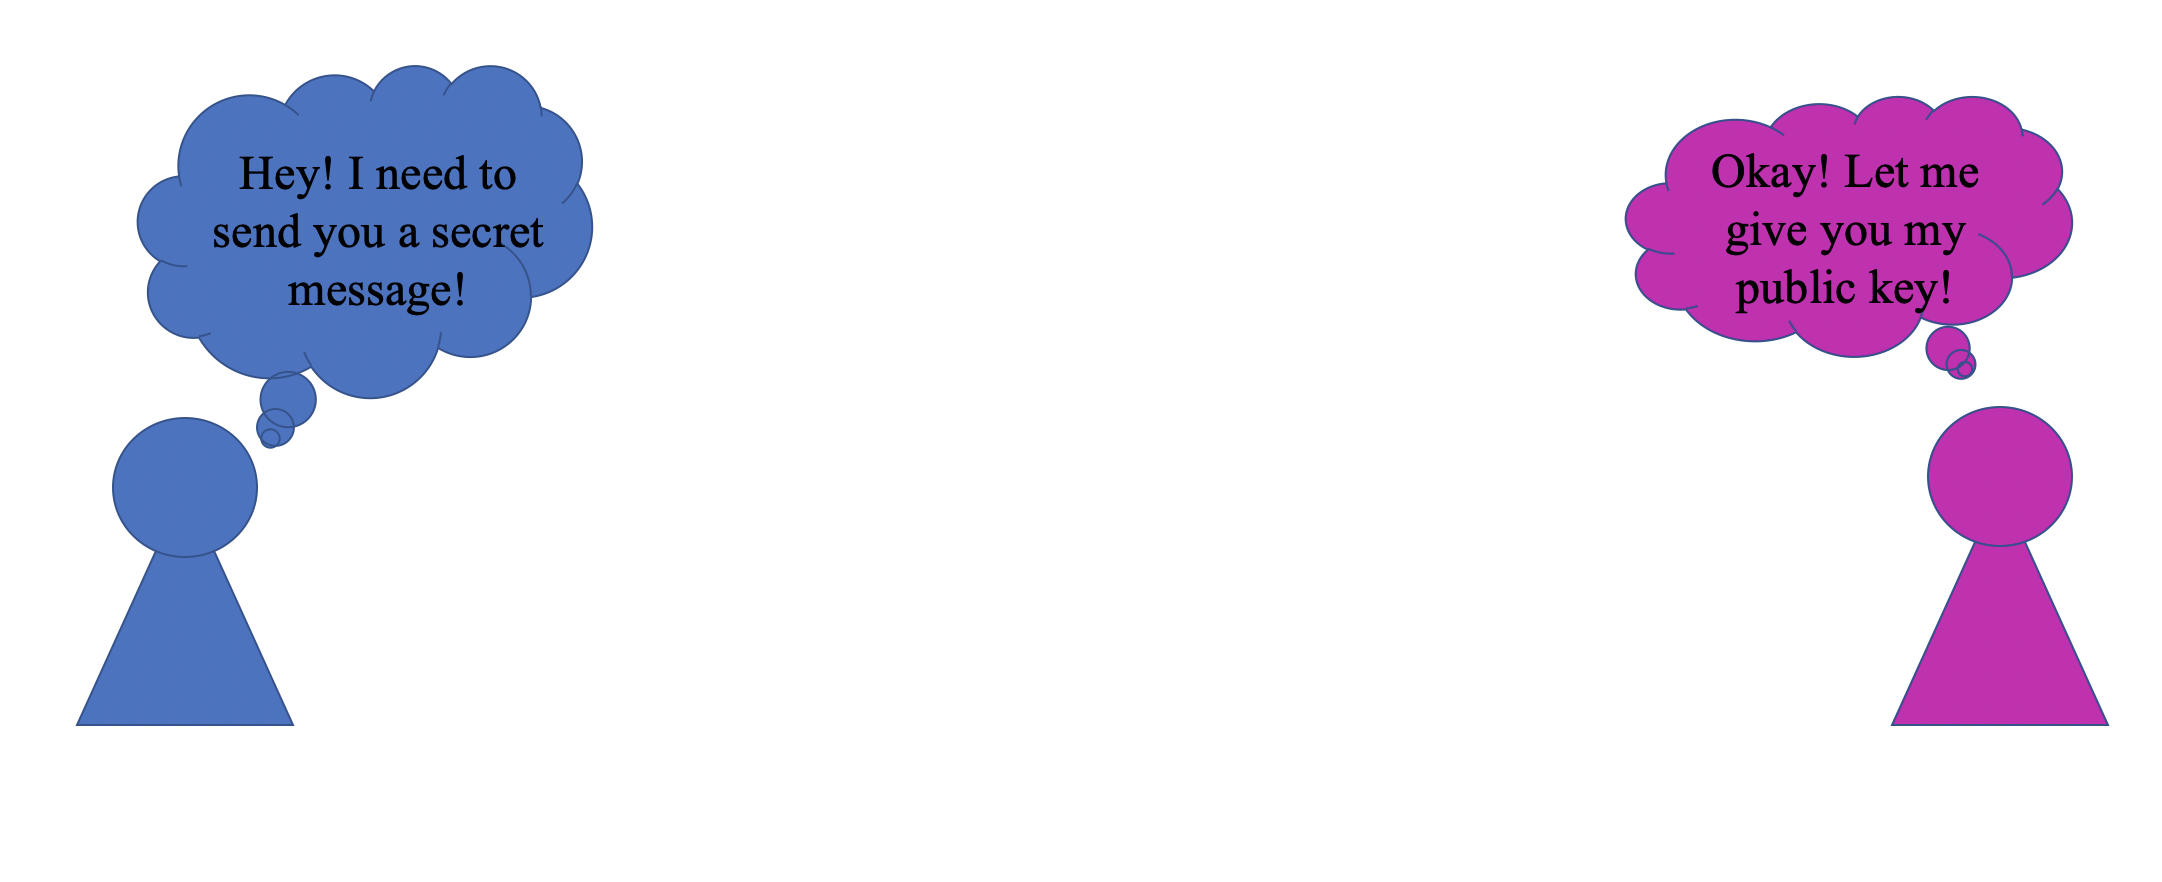
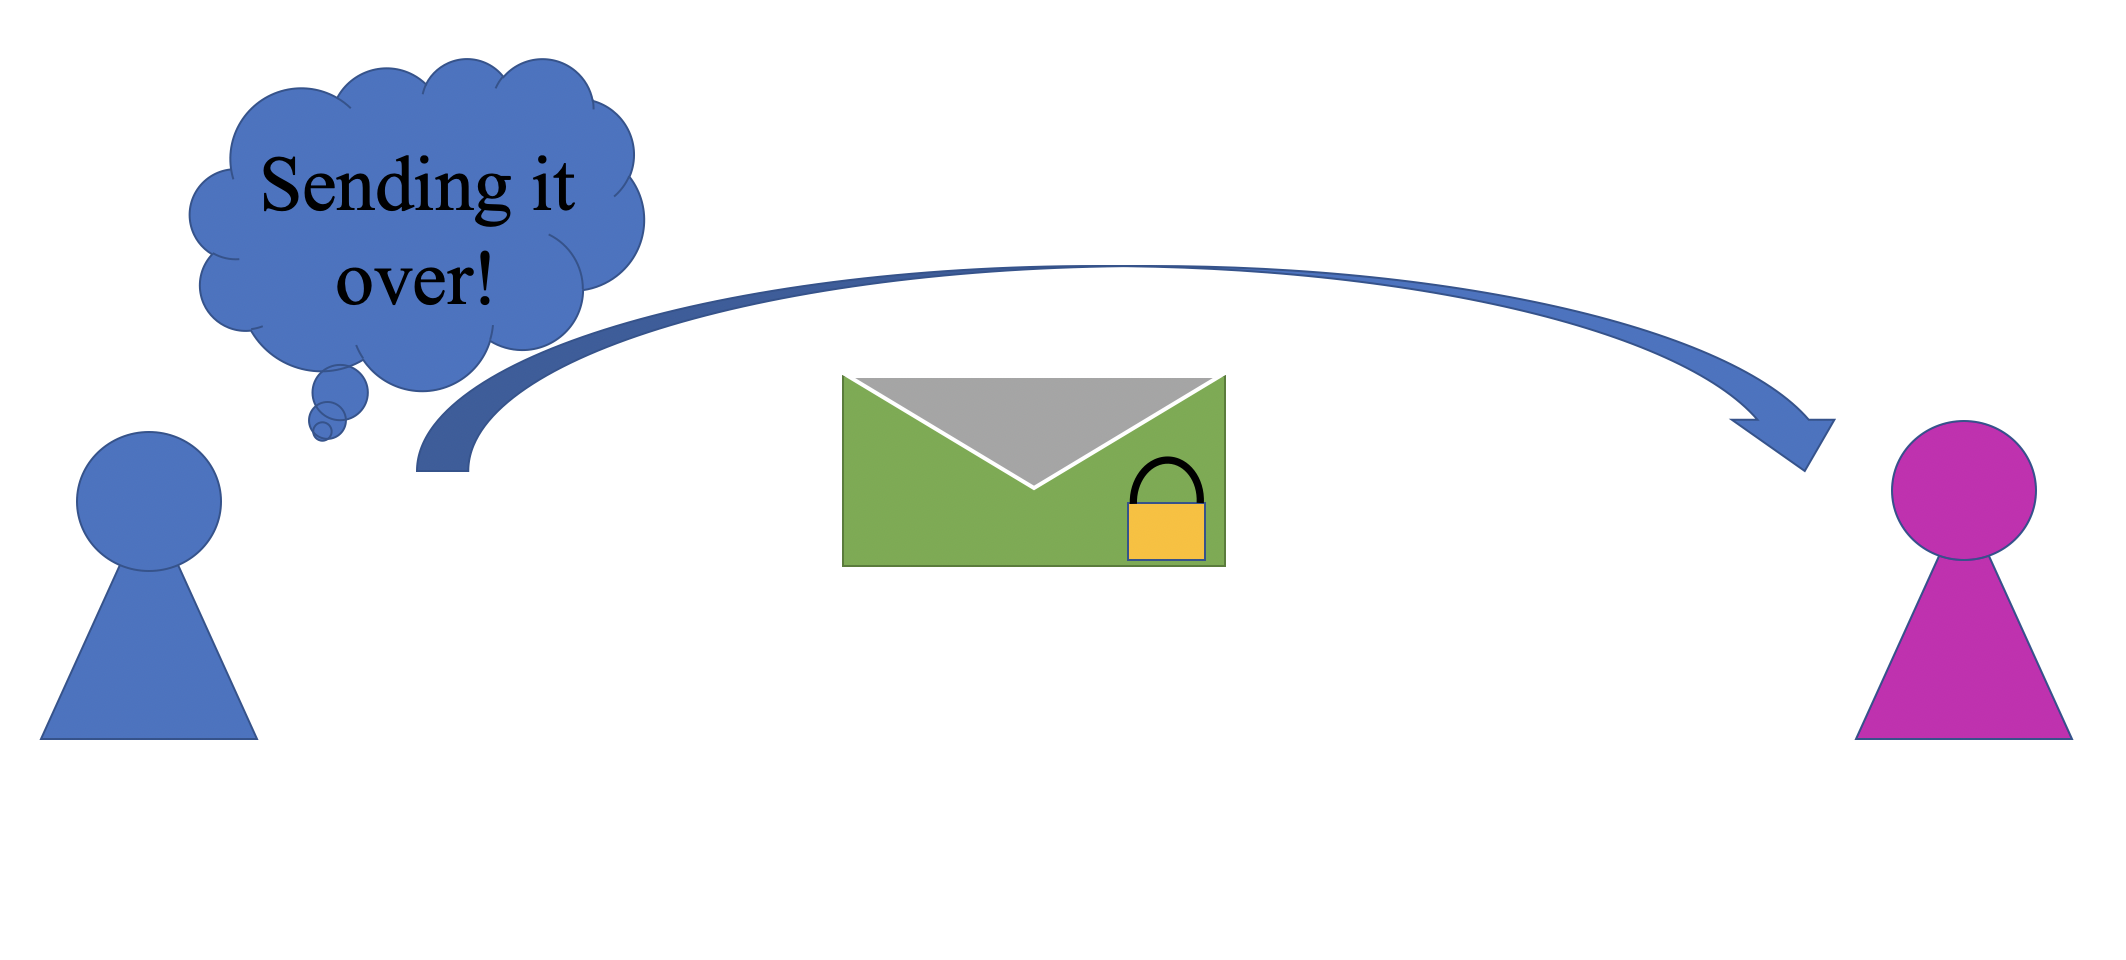
    The actual RSA algorithm is used in public-key cryptography, which is the process that secures data over the internet. It’s a complicated process but the basic idea is this: if Alice wants to send Bob a secret gift, Bob can send her a padlock that only he has the key to. Then, Alice can put her gift in a box and lock it with Bob’s padlock. Then, when Alice sends her package, if anyone tries to steal the gift, they can’t because only Bob has the key. Once Bob receives his gift, all he has to do is unlock the padlock that he gave to Alice. The padlock that Bob gave to Alice is called Bob’s public key, while the key that only Bob has is his private key.

    In the real world, if my friend wants to send me a message, I will give them my public key (which is basically just a really large number). They can then use my public key to encrypt, or hide, the message. Then, in transit, the message is completely safe because I’m the only person that holds the key that decrypts, or unlocks, the message. The only tricky part about the process is making keys that are not able to be broken.

    The Magic Behind It All

    The RSA algorithm is responsible for creating the public and private keys. To create the actual keys, RSA relies on some basic math: modular arithmetic, Euler’s Theorem, and prime numbers.

    To create my public key that I can give to anyone who wants to send me secrets, I do two things:

    • First, I will choose two very large prime numbers, p and q. The multiplication of these two numbers, x = pq, is the first half of the key. The key take-away in this first portion is that the longer that x is, the more secure your key will be. As of 2020 practices, a length of 4096 bits (or characters) is recommended!
    • Then, I calculate another number y by multiplying from the following: y = (p-1)(q-1). From here, I choose a number that is relatively prime to y and call it e. If you don’t recall what it means for two numbers to be relatively prime, it just means that two numbers have a greatest common divisor of 1. In practice, e is typically chosen to be 65,537 – e then becomes the other half of my public key.

    Now, to create my private key that no one else knows about, I use modular arithmetic. If you’re not familiar with modular arithmetic, think of it as the remainder produced after dividing a small number into a big number – for example, 10 modulo 3 = 1 because 3*3 is 9, which leaves us with 1 left over. To create my private key, I calculate the modular inverse of the second half of my public key with the first half of my public key, e modulo x. That’s it! I have my private key! Now I can share my public key with friends, and they can share juicy, secret memes with me without the fear of someone else seeing!

    Convinced?

    What makes RSA so robust and secure is that, even as computers gain more processing power and become faster, all we have to do is increase the length of the key! Think about how fast and powerful our current computers are: our computers are solving problems in astrophysics, mathematics, and are beginning to become ubiquitous in controlling cars. Even with how advanced technology currently is, if someone uses a 4096-bit RSA key, it would take tens of thousands of years for computer to break the code! And even when that’s broken, all we have to do is increase the number of bits in the RSA key and it’s secure for another few thousand years or so!

    If you’re not convinced by how amazing (and even basic) cryptography is, then I don’t think you’re someone who can be easily impressed!

    The Process in Pictures

    If you prefer pictures, here is a simple illustration of the process above:

    Step 1:

    Step 2:

    Step 3:

    Step 4:

    Step 5:

    Step 6:

  • Trees in Computer Science?!?!

    In computer science, there are many ways to organize data to be used effectively. These many ways are called Data Structures. Of the many data structures, there are data structures that are hierarchical in which the data is organized into a tree-like structure. A specific tree data structure that will be taught is a Binary Search Tree.

    In order to learn draw a Binary Search Tree, one must be able to learn the basic things that will help understand.

    A binary search tree is similar to a family tree in a way. Before we begin, lets learn about the different terms that will be useful in understanding.

    Node – a single place where data is.

    Children – the data linked and below another piece of data

    Root – the highest point of data

    Leaf – the data at the ends

    The nodes, root, leaf nodes, and children in a BST


    Now that you know the basics, lets learn specific topics that help understand the different forms of a tree.


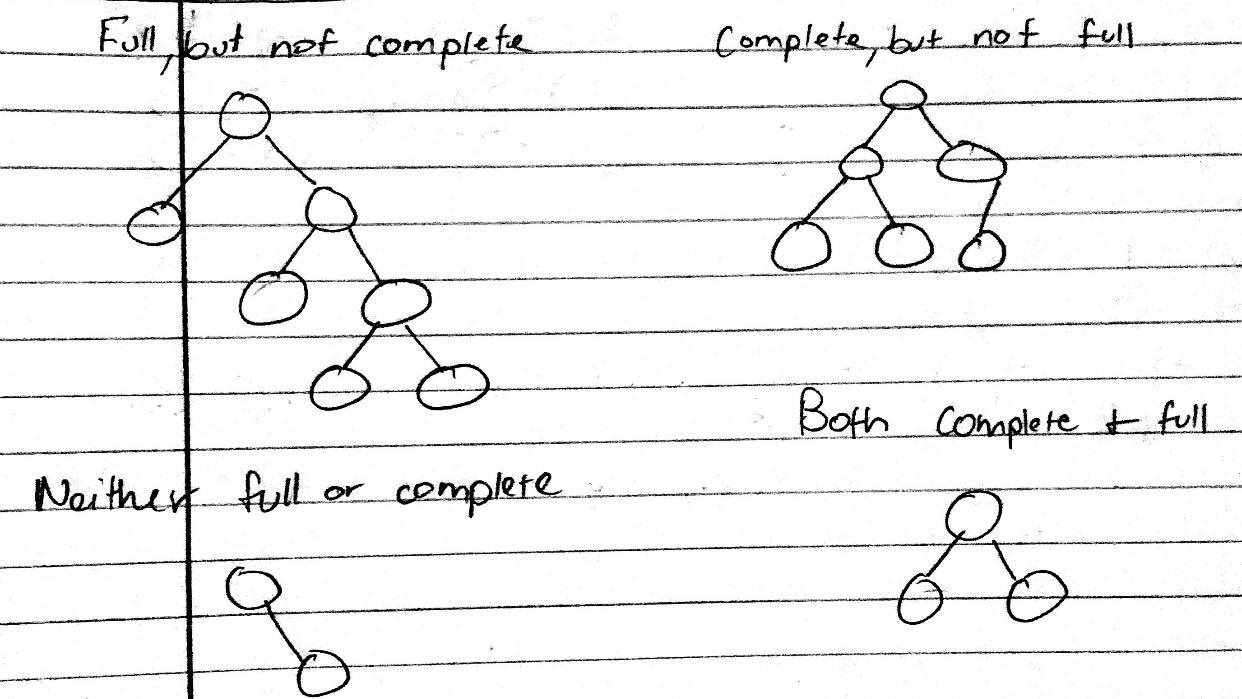
    Full –every node

    other than the leaves has two children

    Complete – every level, except possibly the last, is completely filled, and all nodes are as far left as possible

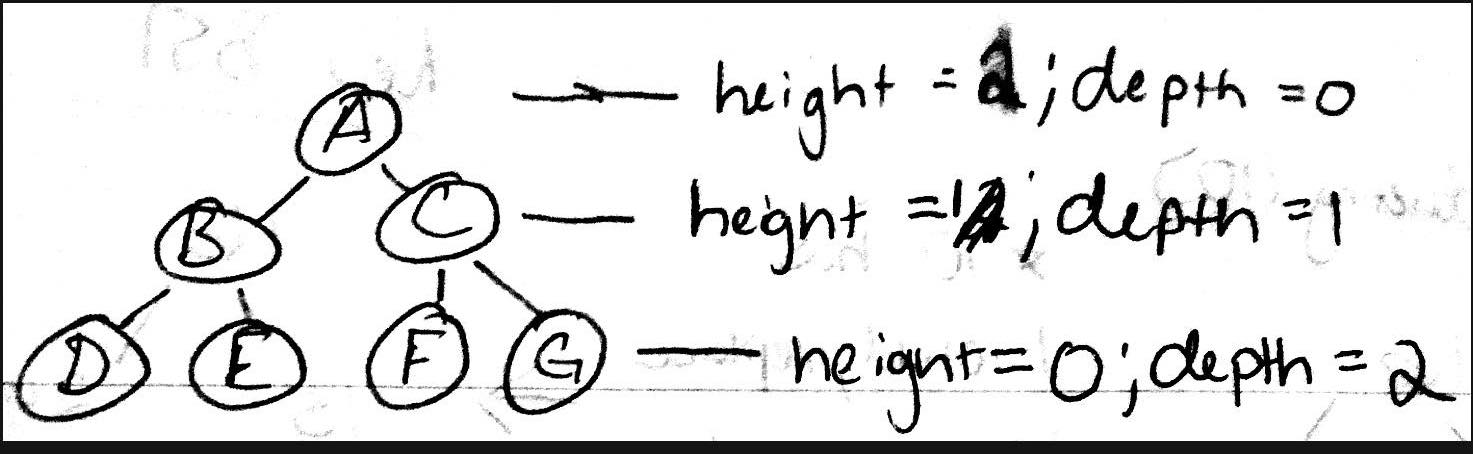
    Height- the longest path from the root node to a leaf node

    Depth – number of edges from the specific node from the root node

    These are different forms of a tree.
    This shows the height and depth of a tree


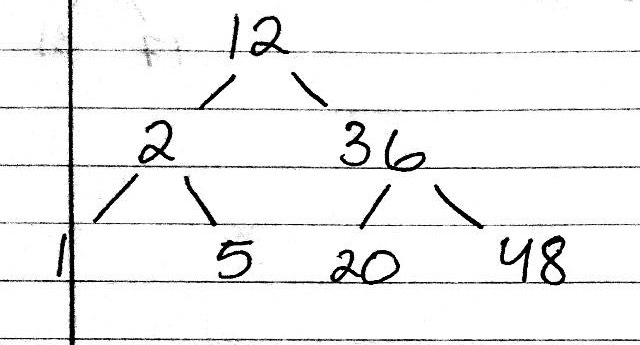
    A binary search tree is a binary tree in which the nodes have a value that is greater than all values in its left subtree and smaller than all values in its right subtree.

    This is how a BST looks like


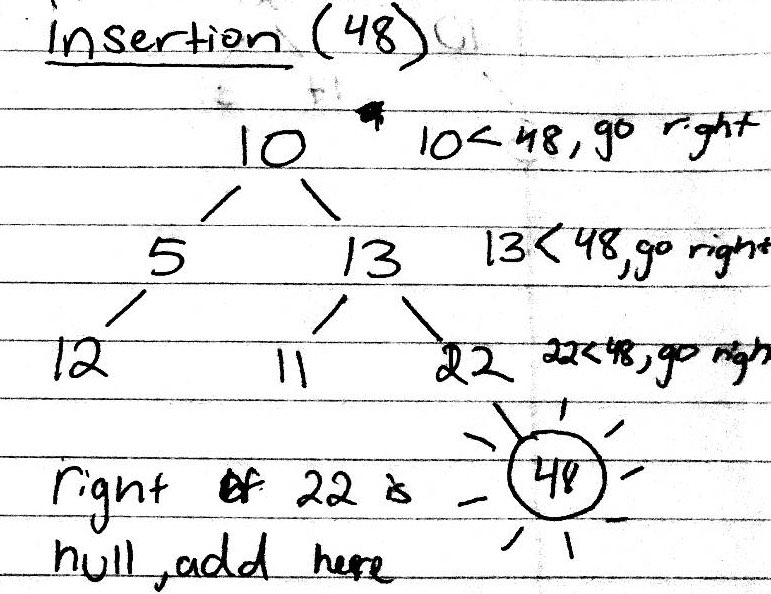
    In order to insert to a BST, you start from the root of the tree and check if the value is greater than or less than that value and if it is greater than the value, then you go to the right and check again if it is greater than or less than the value and so on and so forth until you get to the end where you add that value to the tree.

    This is how to insert data into a BST


    Deleting a node in BST

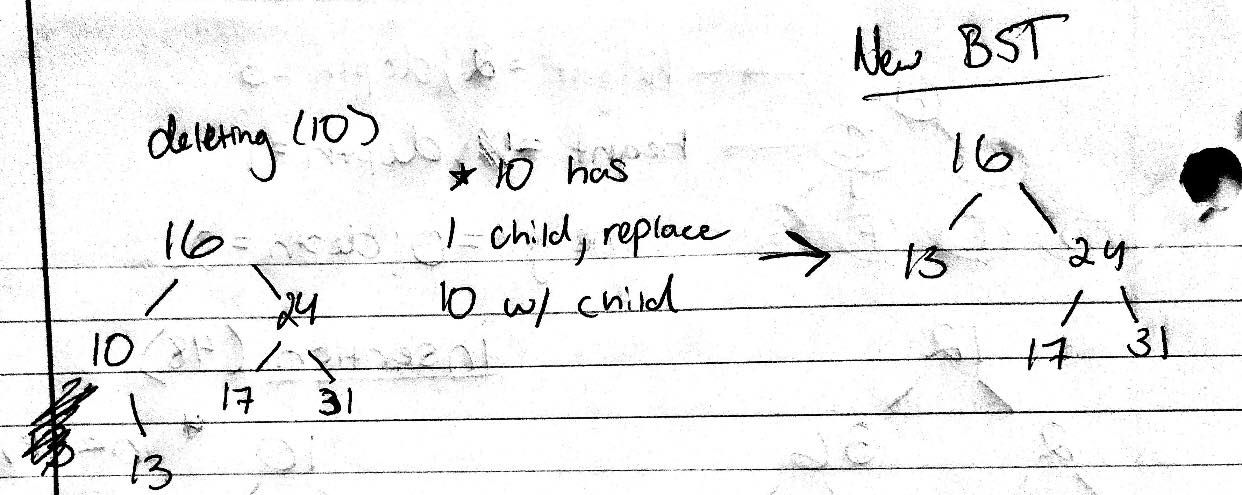
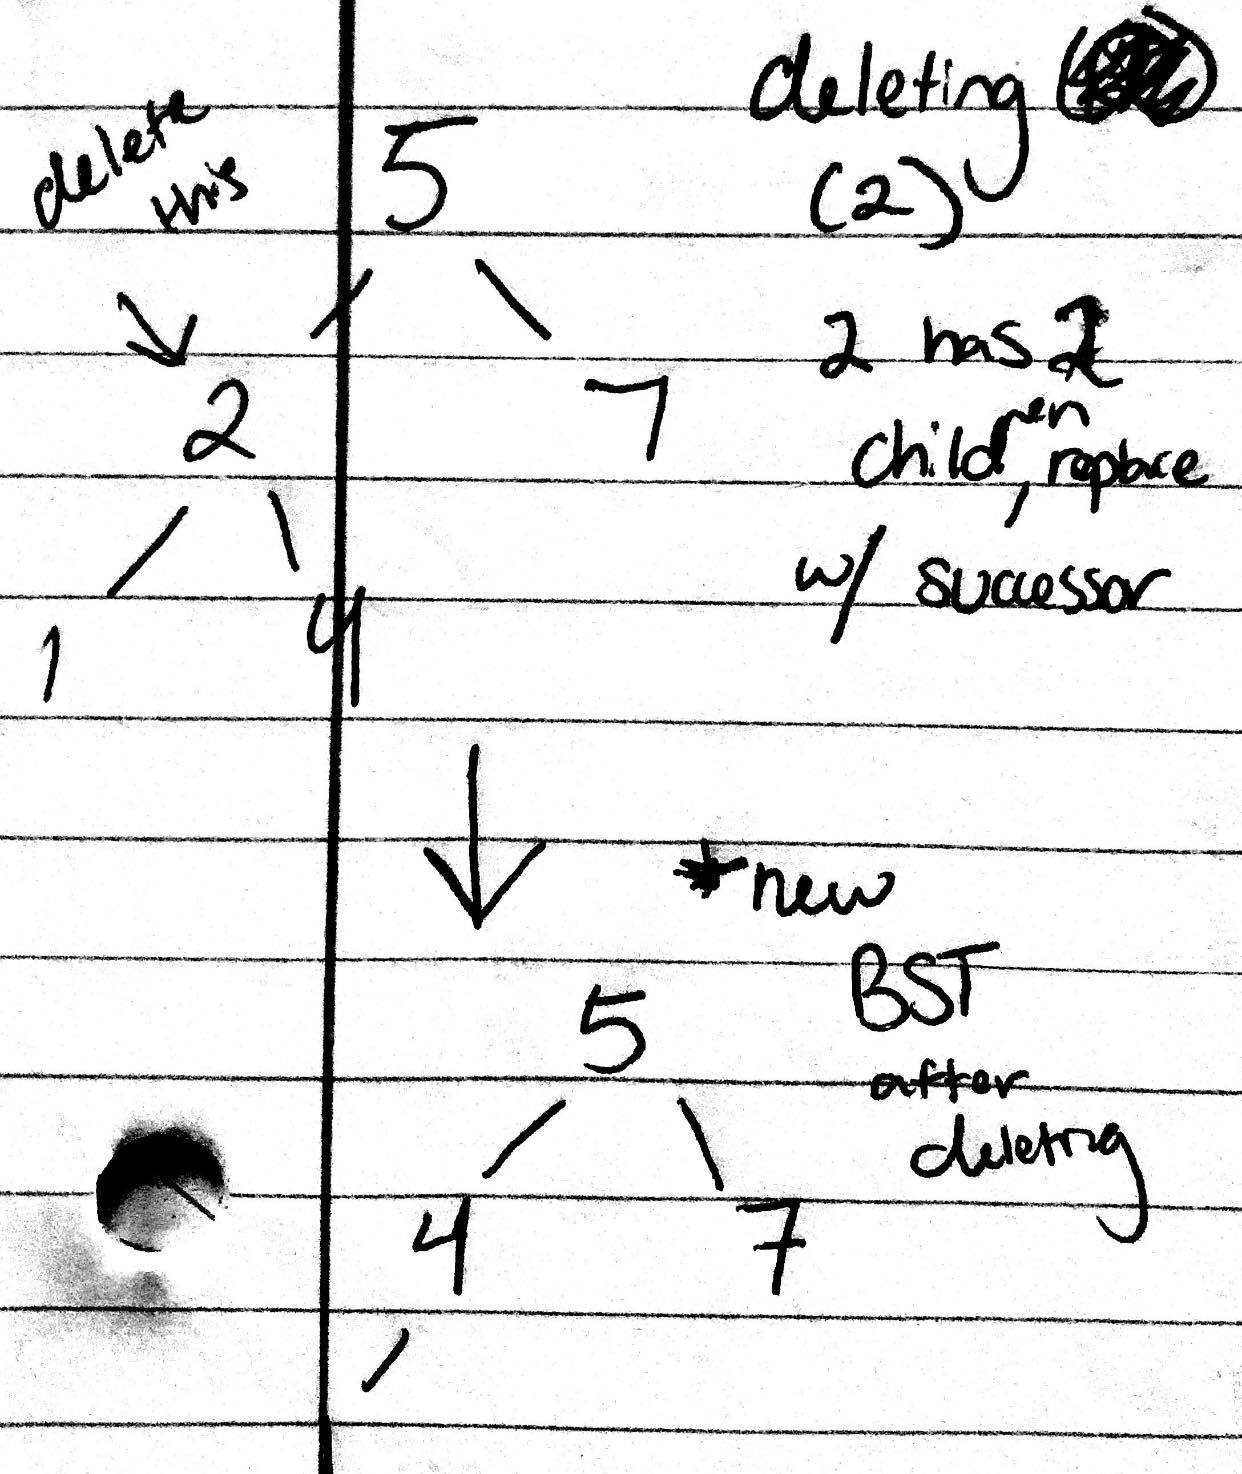
    When deleting a node within a BST, there are many considerations to check for. The first thing to check is to see if the specific node has any children.

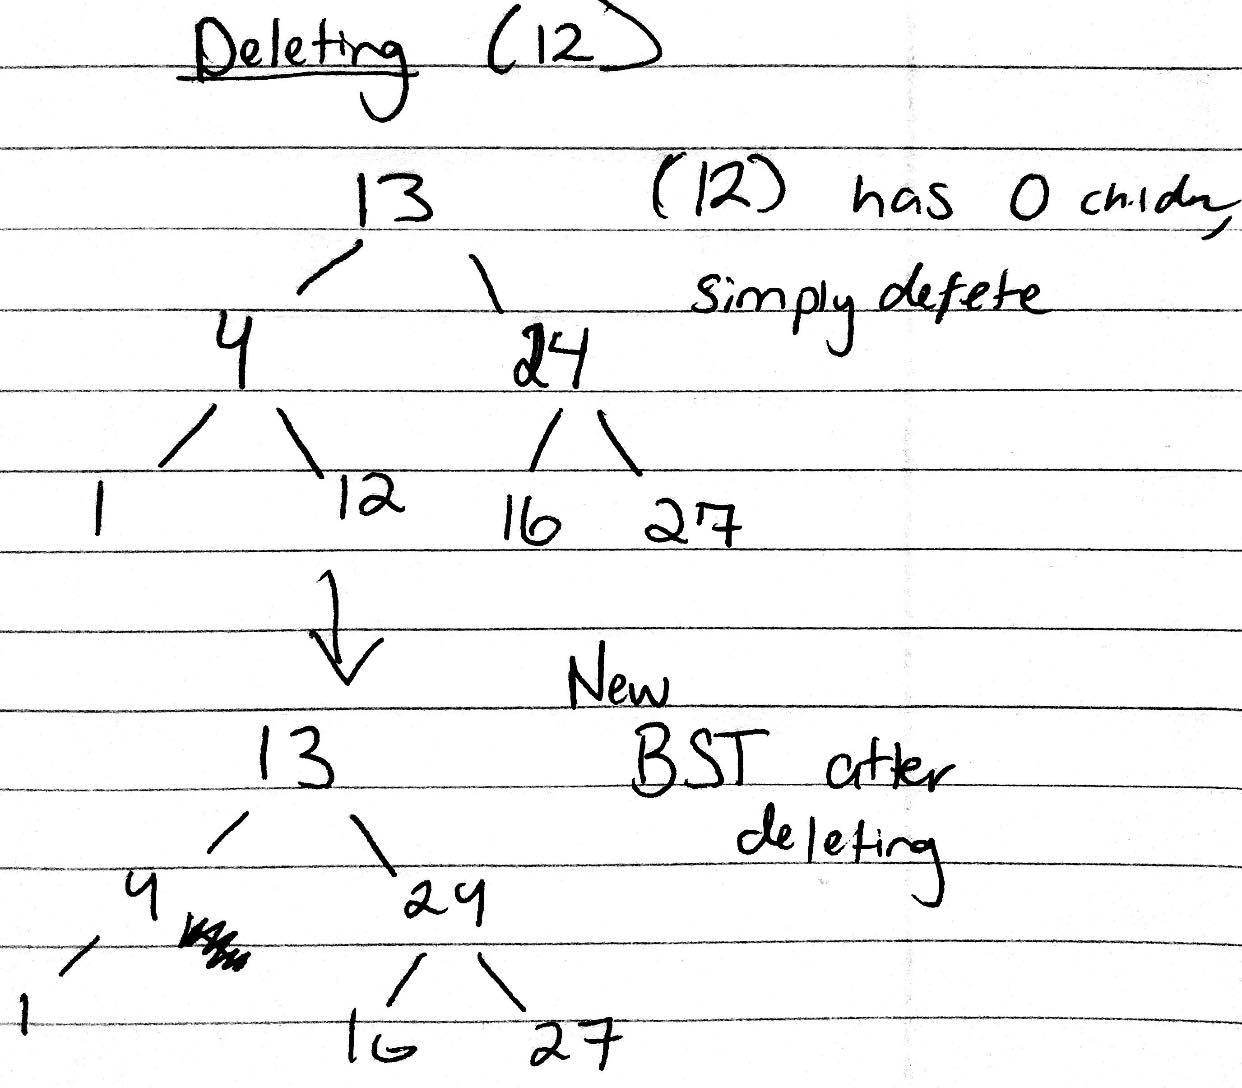
    • If the node has 0 children
      • In this case, you simply delete the node from the BST
    • If the node has 1 child
      • In this case, you replace the node to delete with the child
    • If the node has 2 children
      • In this case, you must replace the node with either the predecessor or successor
        • A predecessor is the maximum value in the node’s left subtree
        • A successor is the minimum value in the node’s right subtree
    Deleting from BST, if the node to delete has 0 children.
    Deleting from BST, if the node to delete has 1 child.
    Deleting from BST, if the node to delete has 2 children.


    Good job! You have now mastered one fundamental aspect within Computer Science and are one step closer to being a programming genius!!!


    Citations:

    Binary Trees. (2009). Retrieved from https://www.cs.cmu.edu/~adamchik/15-121/lectures/Trees/trees.html

  • Clarified Purple Cow Punch

    This year, continuing the theme from the Taste of Science, the Georgia Tech STEMcomm team decided to host a Sober Science Speakeasy, a party all about the science of drinks. While looking around for something to prepare, the concept of “clear milk” was brought up, and I was intrigued. Clear milk? That’s practically oxymoronic. And yet, these drinks, called “clarified cocktails” or “milk punches”,  added milk to end up with clear, colorless products. Naturally, we had to investigate and try for ourselves. This is what we learned:

    The Science:

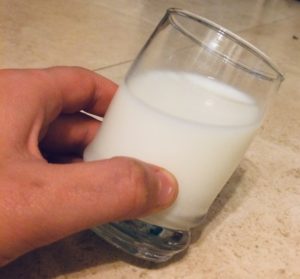
    Milk, looking decidedly not clear, due to the Tyndall effect.

    Milk is a colloid, with fat and proteins suspended in the aqueous solution. Since these are fairly evenly distributed, they usually scatter the light beam around in all directions in the Tyndall effect, making the liquid appear white and opaque.    Proteins in the milk, particularly caseins, repel each other at the normal pH of milk, which is what maintains that even distribution throughout. This is because the isoelectric point of casein, or the point at which it it is electrically neutral (uncharged) is around 4.6, but milk’s normal pH is closer to 6.6. The casein proteins therefore have a negative charge that makes them repel one another and spread out as far apart as possible.

    When pH of milk is lowered however, by adding acid, the casein proteins will lose their negative charge, and stop repelling one another. This, along with the protein degradation, or unfolding of their shape, at the lower pH, causes many of them to clump together in solid blobs we call “curds”. They will separate out to the bottom, and the liquid left behind is called the “whey”. But these proteins don’t just separate from the rest of the drink- they take compounds with them, including much of the color! The proteins bind to molecules from the drink, especially polyphenols, which are associated with bitter/astringent tastes, like tannins in black tea or red wine.

    Therefore, when you strain out the curds, you also remove compounds bound to the caseins. This “clarifies” the drink, stripping away most of its original color, and giving it a less harsh flavor. Some also claim that the addition of the remaining milk whey also gives the drinks a sliker texture, making them even more desirable.

    The Drinks

    This property of milk has been used to make clarified cocktails for many years, with the first written recipe dating all the way back to 1711. Even our favorite kite-flying founding father, Benjamin Franklin, was a fan, recording his own recipe for brandy-filled milk punch in 1763. You can still see the original document online in the Massachusetts Historical Society archives: https://www.masshist.org/database/263.

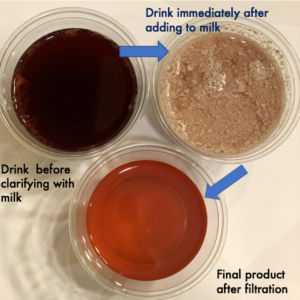
    A resident “mad scientist” with the original base, sans milk.

    In our case, we went for a non-alcoholic version, with a base of black tea, grape juice, lemon juice, and of course, milk.

    This concoction, lovely nicknamed “clarified purple cow punch” or CPCP, was initially dark reddish-purple, and while sweet, was also tad bitter from the black tea flavoring. The addition of the juice to milk resulted in a (rather unappetizing) mixture of curdled milk and juice in a clumpy, brown…milkshake? Ick.

    At that stage, I was pretty doubtful that this was going to work. With a bit of patience, however, and several rounds of straining through cheese clothes and coffee filters, we ultimately ended up with a pale pink, ultra-sweet drink that proved pretty popular. There was no hint of milk flavoring or bitter taste, and all together, CPCP was a surprising success.

    If you want to try making clear drinks yourself, all you need is some juice mix, an acid, and milk- and a lot of time to sit and watch the straining process. Make sure to add the acid slowly to the milk, and not the other way around, to ensure the proteins have time to bind to the polyphenols before curdling, and you’ll be all set to impress with your friends with this magically clear milk.

  • Butterfly Pea Flower Tea

    A cup of tea brings feelings of peace and serenity to mind.  Whether it be a rainy day or cold evening, drinking a warm cup of tea has never failed to help me feel calm and happy.   There’s an amazing selection of tea for all types of different palates to choose from like your classic green, black, and white tea, but my personal, newfound favorite is butterfly pea flower tea!  Befitting its exquisite name, this tea also has an appearance like no other.

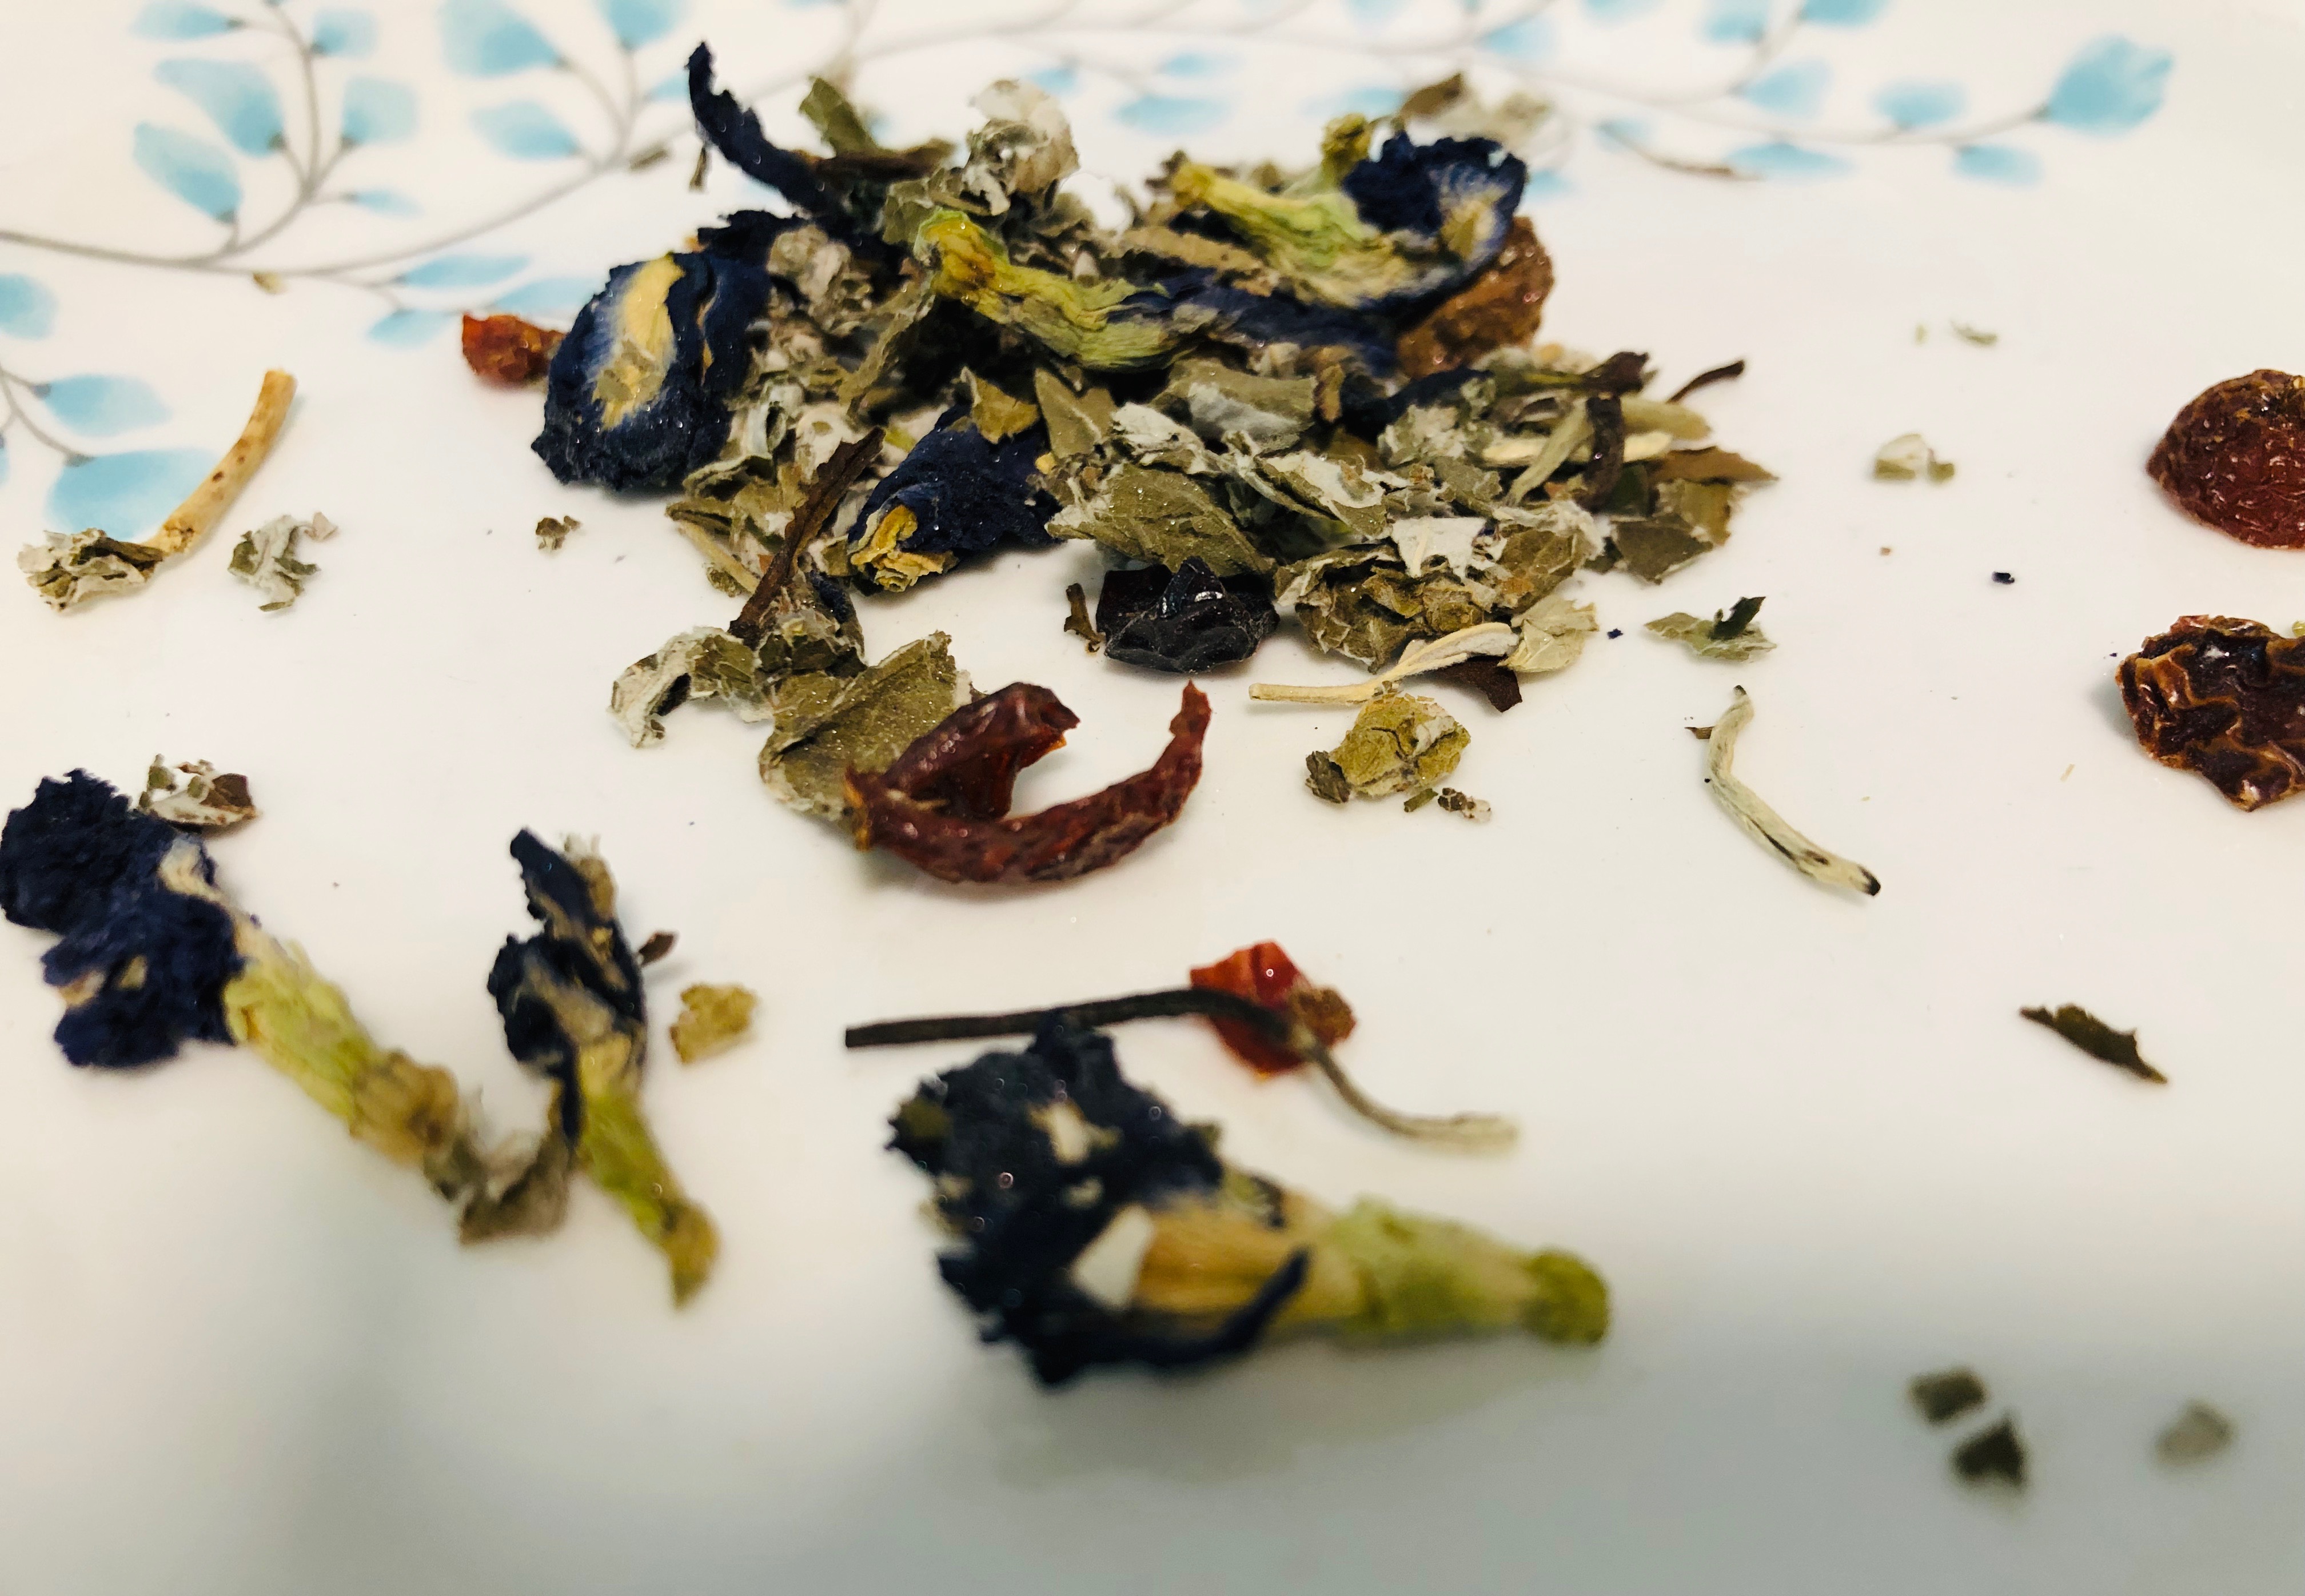
    Butterfly pea flower tea may seem like a new and recent addition to tea shelves, but this tea has been consumed in Southeast Asian countries like Thailand and Malaysia for centuries.  It is a caffeine-free beverage made from oftentimes dried lemongrass and blue flowers and leaves of a plant known as Clitoria ternatea (Centeno, 2018).  It is said to have an earthy taste similar to green tea despite its color (Goldberg, 2016).

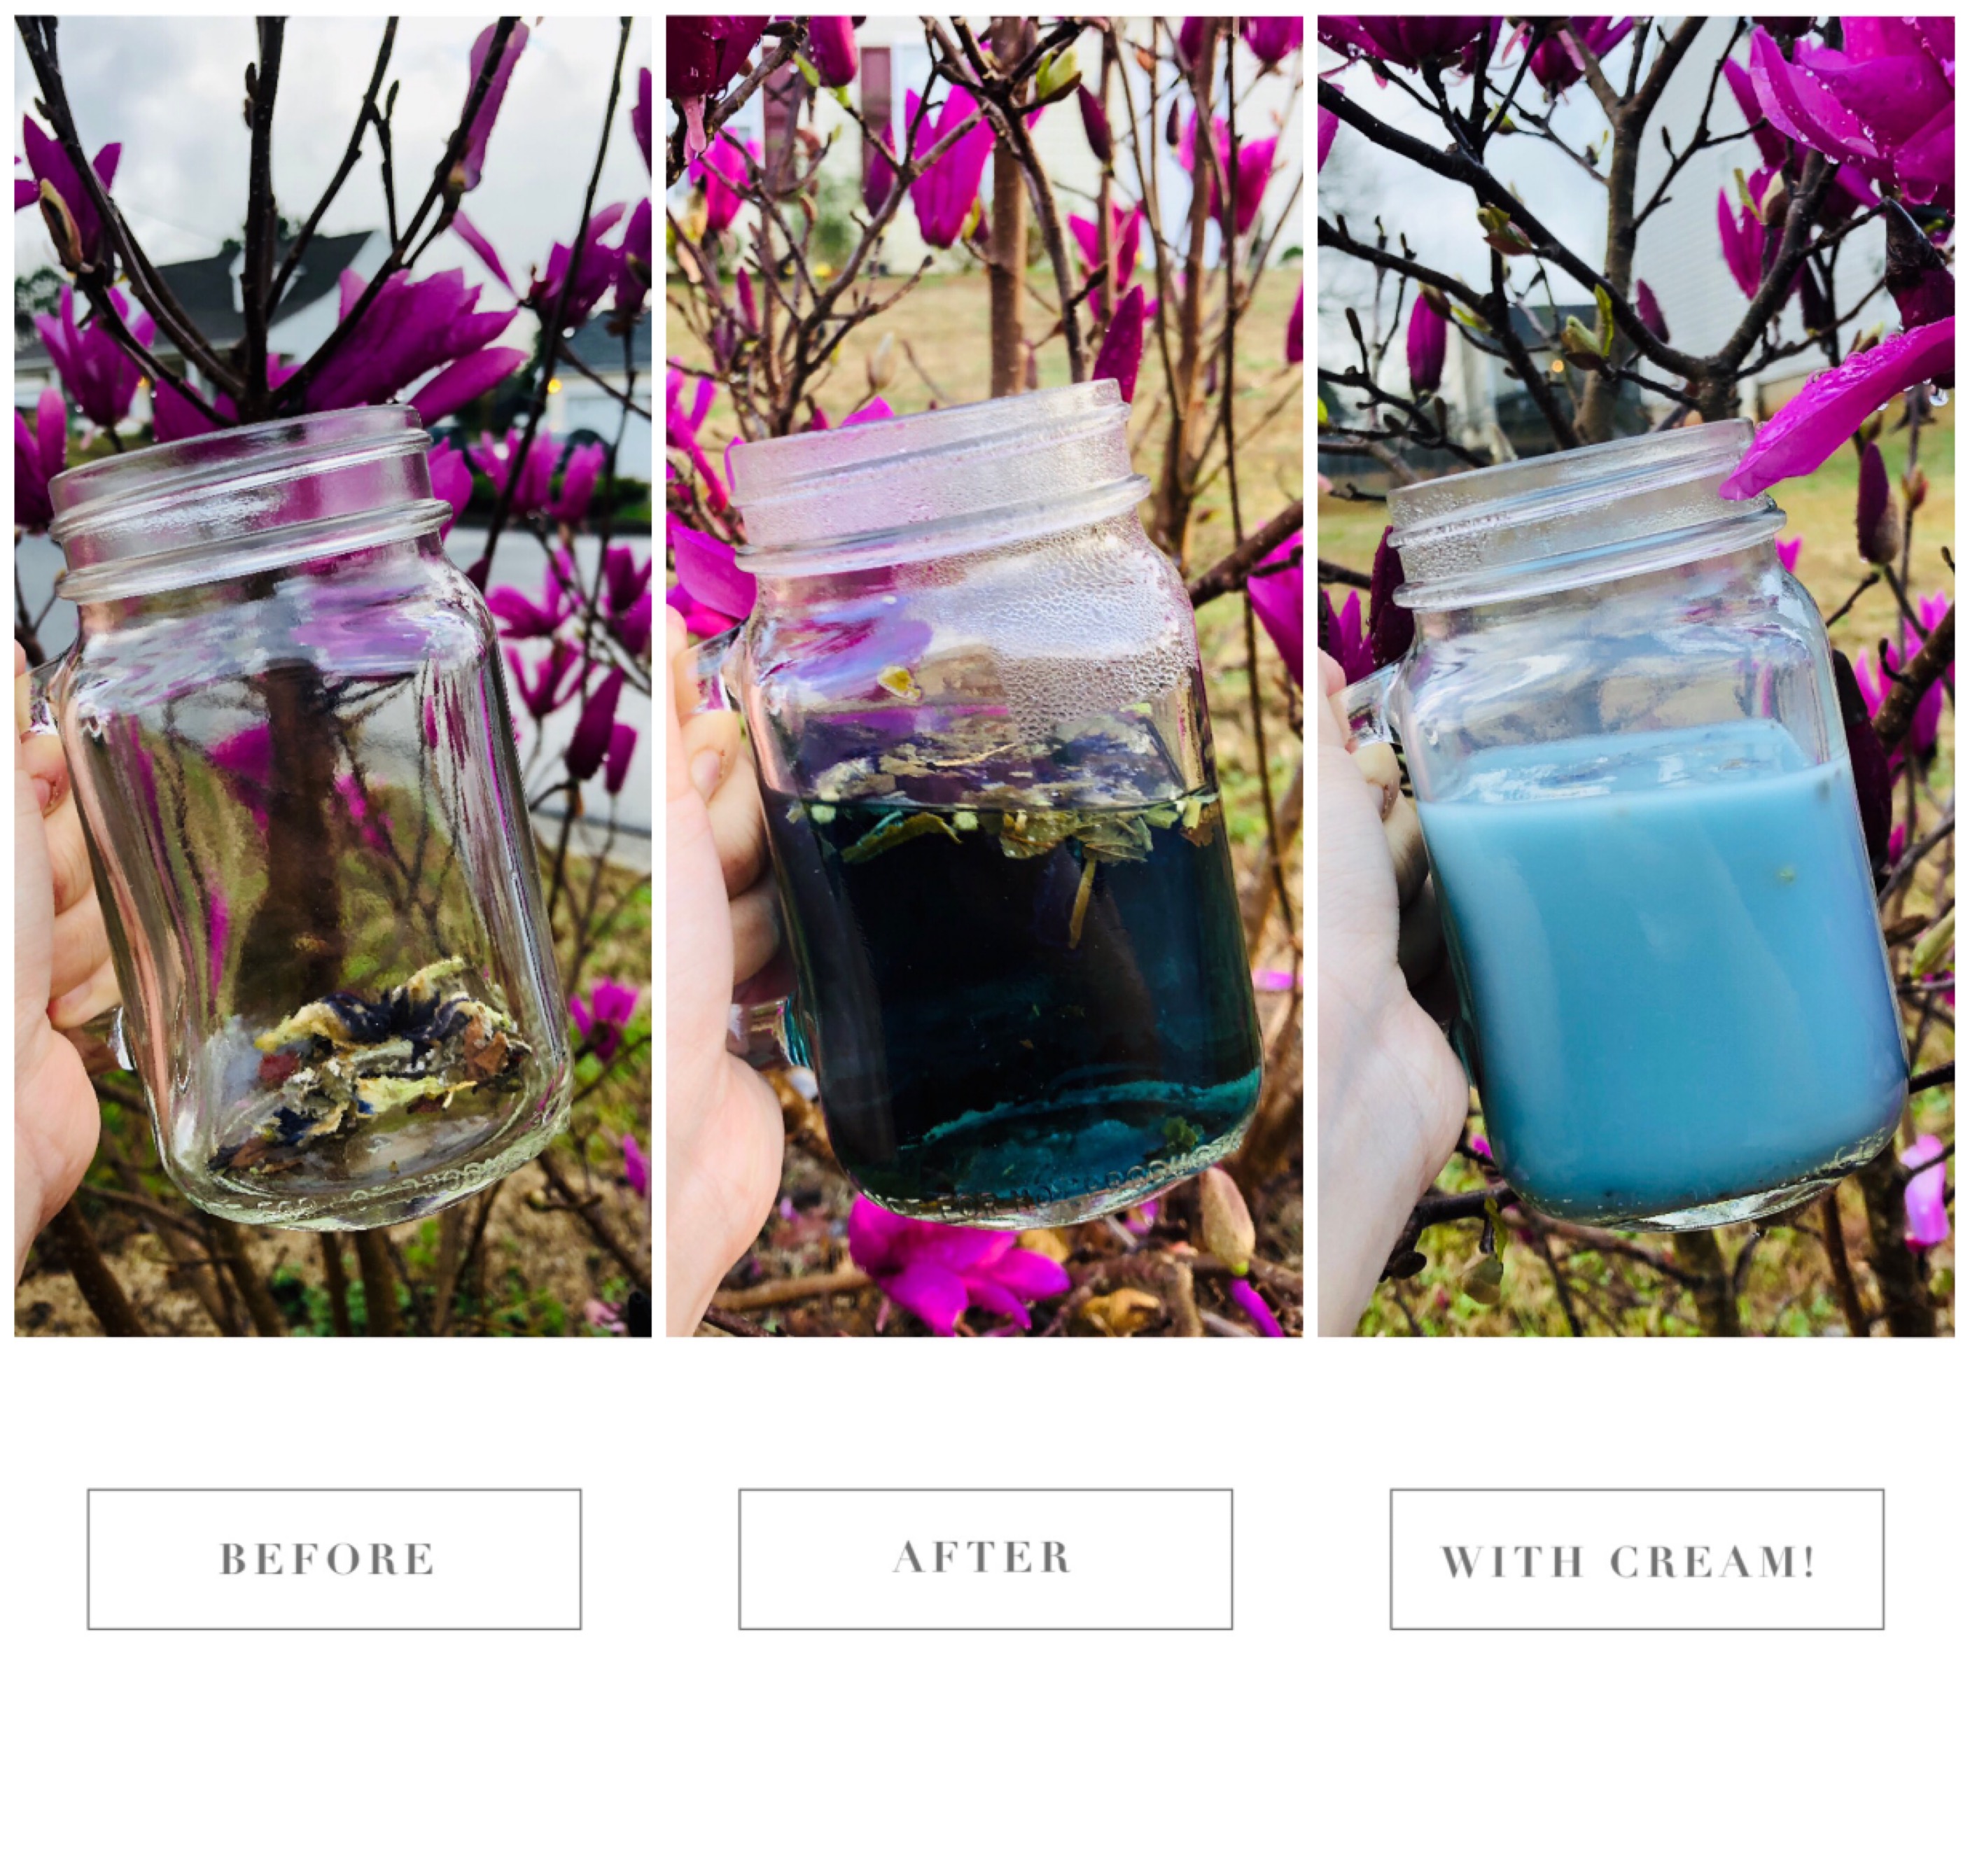
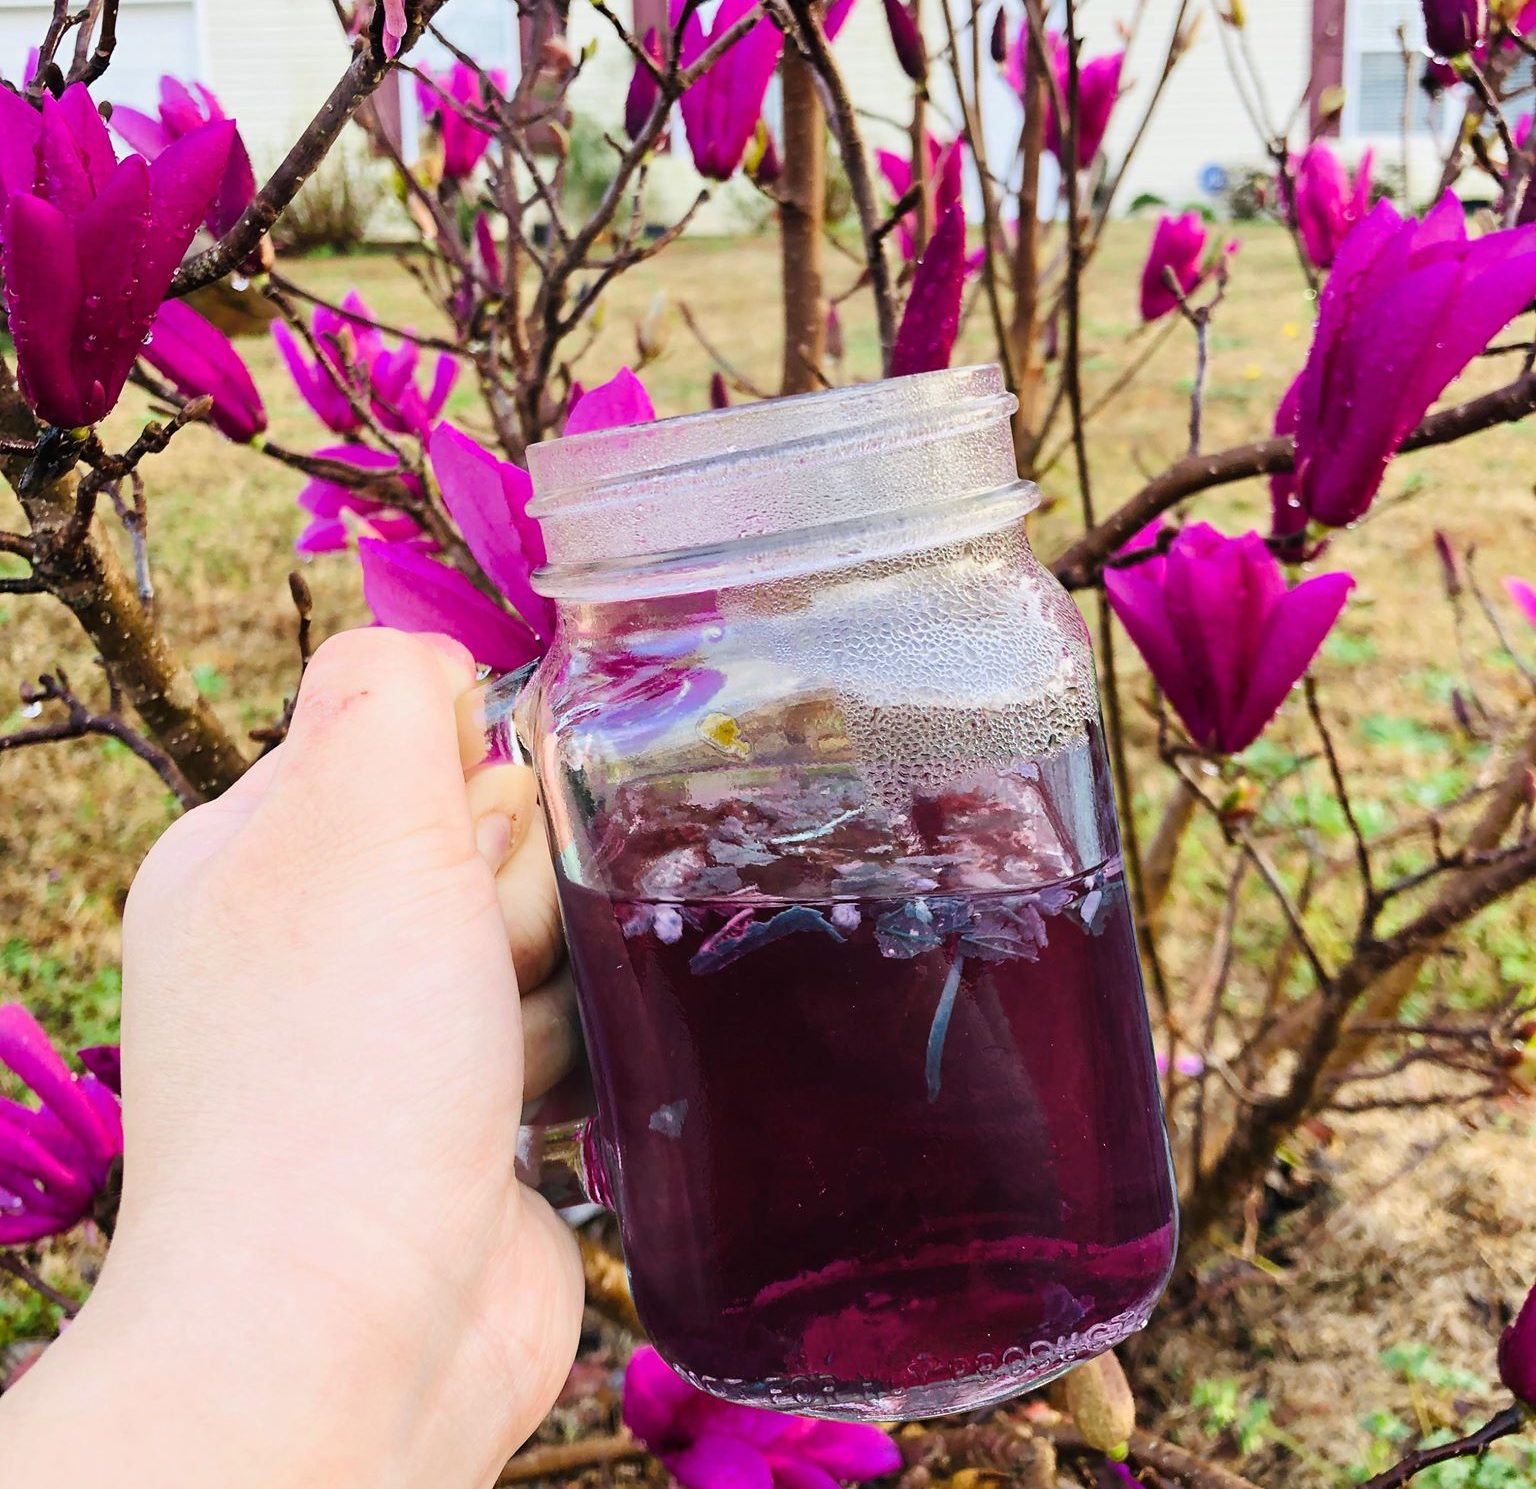
    What makes this tea unique, however, is not just its natural, blue color, but its ability to change color depending on pH.  Adding lemon will allow this beverage to take on a purple color (see below).  Add more and it’ll turn hot pink, adding a perfect and mesmerizing ombre. Like other plants that function as pH indicators, butterfly pea consists of anthocyanins, allowing it to change color.  The plant has been tested as a pH indicator to successfully differentiate pH levels between 2-12 (Amaolo, 2017).

    Anthocyanins also contain high amounts of antioxidants, making blue tea a common use in traditional medicine and a source of many health benefits (Kungsuwan, Singh, Phetkao, & Utama-ang, 2014).  Butterfly pea flower extract has been found to have anti-inflammatory and pain-relieving abilities (Kumar and Ishwar, 2012) as well as the potential to relieve diabetic complications caused by advanced glycation end products (AGEs).  AGEs are compounds that can clog vessels and form more often in diabetics when sugars combine with particular amino acids (Barone, 2017).  Clitoria ternatea extract has also been found to improve memory and acetylcholine levels (Taranalli & Cheeramkuzhy, 2011) and has anti-depressant, anti-stress, anti-convulsant, and anti-microbial properties (Jain et al., 2003).   Its antioxidant activity has also been applied in cosmetics (Kamkaen & Wilkinson, 2009).

    Try making your own tea by seeping 1-2 teaspoons of butterfly pea flower with a cup of water and add honey, lemon, juice, or milk for more flavor.  You can also make ice cubes with the tea to add color to any drink!


    References
    _______________________________________________________________________________________________________________

    Amaolo, A. (2017). The Butterfly Pea Flower as a pH Indicator. Retrieved from http://isjos.org/ISJOSv11p2-ButterflyPeaIndicator.pdf

    Barone, J. (2017, February 28). What Are AGEs (Advanced Glycation End-Products)? Retrieved from http://www.berkeleywellness.com/healthy-eating/food-safety/article/abcs-ages-advanced-glycation-end-products

    Centeno, E. (2018, July 03). What is Butterfly Pea Flower Tea? Retrieved from https://spoonuniversity.com/lifestyle/what-is-butterfly-pea-flower-tea-hint-it-changes-color

    Goldberg, E. (2016, January 31). The Science Behind This Mesmerizing Color-Changing Tea. Retrieved from https://www.bonappetit.com/drinks/non-alcoholic/article/butterfly-pea-flower-color-changing-tea

    Jain, N. N., Ohal, C. C., Shroff, S. K., Bhutada, R. H., Somani, R. S., Kasture, V. S., & Kasture, S. B. (2003, June). Clitoria ternatea and the CNS. Retrieved from https://www.ncbi.nlm.nih.gov/pubmed/12895670

    Kamkaen, N., & Wilkinson, J. M. (2009, November). The antioxidant activity of Clitoria ternatea flower petal extracts and eye gel. Retrieved from https://www.ncbi.nlm.nih.gov/pubmed/19367668

    Kumar, S. & Ishwar, B. (2012, March 19). Anti Inflammatory, Analgesic and Phytochemical Studies of Clitoria Ternatea Linn Flower Extract. Retrieved from https://irjponline.com/admin/php/uploads/935_pdf.pdf

    Kungsuwan, K., Singh, K., Phetkao, S., & Utama-ang, N. (2014). Effects of pH and anthocyanin concentration on color and antioxidant activity of Clitoria ternatea extract. Retrieved from https://www.tci-thaijo.org/index.php/fabjournal/article/view/77397

    Taranalli, A., & Cheeramkuzhy, T. (2011, January 10). Influence of Clitoria Ternatea Extracts on Memory and Central Cholinergic Activity in Rats. Retrieved from https://www.tandfonline.com/doi/abs/10.1076/1388-0209(200001)3811-BFT051