Category: Articles

  • Why Design?

    One of the most challenging questions I am asked as a designer is why I chose the study path I chose. I am often asked Isn’t that just the same as being an art major? or Why not choose something more useful like Computer Science or Engineering? Sometimes, I ask myself those same questions. What exactly is it that I am doing?

    In my mind, the word “design” brings up many different images. Often I will picture a fashion designer with measuring tape and a model in front of her, or a car manufacturer sitting in a dark room with only a lamp as a source of light sketching the future of the automotive industry. I even picture a mad painter brushing frantically across a canvas creating a new masterpiece. The word “designer” meant so many different things that it was nearly impossible for me to know the true definition. All I knew was that all designers shared a common trait: their creativity. And, as luck would have it, I would spend my first several years of life developing my creative side, leading me to where I am today.

     For as long as I can remember, I have loved making things. It sounds cliche, but it’s true. I used to collect scraps of paper, out-of-shape paper clips, and many other things considered “trash” and assembled them into tiny sculptures as gifts for my friends and family. I was especially guilty of trash collection in school. My 2nd-grade teacher constantly criticized my never-ending mess, until the end of the year came. She chose to look beyond the mess inhabiting my tiny desk and focused on the small figures. From there, she deemed me the “Class Creator”. It was one of the first memories I had where my art was recognized by someone who wasn’t a relative or a  friend of my parents. Of course, the support of my parents played a significant role in my decision. They were the ones to shine the light for me, guiding me to where I needed to go.

    Fast forward several years and it’s finally time to apply to colleges. As a Junior in High School, I was expected to have already a list of schools I wanted to visit and, possibly, apply to. Like many others before me, I was completely lost on where I wanted to go, let alone study. I couldn’t decide if I wanted to go to a big or smaller school, out of state or in the state, and traditional or technical. This indecisiveness led me to begin my college search more locally because “it makes the most sense” as my mom put it. And she was right. I was enchanted by the schools neighboring my home: UGA, Emory, and Georgia Tech.

    While filling out my applications, I was unsure what I wanted to study. In the end, I decided to apply for mechanical engineering programs. At the time, it seemed like a sensible choice, given that it involved the creation of things. However, engineering focused on the more technical aspects of design, the “mechanics” if you will. As cool as that sounded, the thought of performing primarily calculus as a career for the rest of my life terrified me. My life would become mathematics. My creativity would be confined to the laws of physics and thermodynamics. As much as I tried to convince myself that that was what I wanted, it wasn’t. 

    Stumbling across the School of Industrial Design’s webpage was a godsend. It looked like what I imagined I would be doing as a mechanical engineer, only more eye-catching. I saw the beautiful designs that other students had developed and the effort they put into the aesthetics of the designs. It was everything I had been searching for. It was exactly what I wanted to do.


    Industrial Design. The second I decided to scroll through the Launchpad Portfolio on this secret website I had just discovered, I fell in love. Hard. Seeing students take their artistic abilities and create new things for people not just to enjoy, but use? Everything changed for me there. No longer was I doubting the decision to transfer to Georgia Tech, I simply changed the way I went about it.  I finally understood what being a designer meant. My choice to become a designer has been one of my best.

    Works Cited

    https://www.degreequery.com/wp-content/uploads/2019/01/industrial-vs-eng-smart-660×445.png

    https://th.bing.com/th/id/OIP.zXqHiS3fKQLuQQCC5Q9-IQHaCl?w=293&h=122&c=7&r=0&o=5&dpr=2&pid=1.
     

  • Marine Birds Fly Into Storms to Survive?

    In a recent article written by Freda Kreier, I learned about a very interesting phenomenon that some researchers have discovered. Many different species of seabirds have had their behavior studied during typhoons in the seas around Japan.

    What’s going on?

    Let’s get straight to the point. Some seabirds are flying directly into storms! The observations of the birds’ behavior differed greatly when a storm was present and when one was not. It’s as if the birds sense the storm coming, and head to the center. An example of this behavior can be seen in the following video:

    In this video, the various colorful paths are flight paths of streaked shearwaters and the black path is the path of storm “Soulik” and typhoon “Jebi” respectively. You can see that as Soulik approaches, many of the birds alter their course directly into the direction of the storm. Then, right after Soulik, Jebi appears and the birds nearest to the typhoon engage in similar behavior.

    You can find more evidence of this behavior in different scenarios in this research article: https://www.pnas.org/doi/10.1073/pnas.2212925119

    Why?

    Now, let us discuss why on Earth this would be happening! As discussed by Emily Shepard, a contributor to the previous research article, during a storm, birds at sea have nowhere to go. Their options to choose from are not ideal in the slightest. Birds can either go inland if they are close enough, or stay out on the ocean.

    Two Choices:

    Go Inland

    Even though going inland may seem like an obvious safe option, it is often much safer for these birds to stay out in the ocean. If a bird were to stay near shore during a storm, it runs the risk of being blown onto land or hit by debris carried by the strong winds.

    Remain At Sea

    Being at sea during a storm instinctively sounds dangerous to most people. However, it might be the safest option! If a bird were to go towards the storm, it has the ability to coast along, riding on the winds of the storm. An analogous situation might be when a person gets swept out to sea by a riptide. In that scenario, the best course of action is to float and allow yourself to be carried by the current. If you fight it, you will become tired and possibly drown. I believe this is why the birds do this. It makes sense to just float along with the winds and preserve your energy until its over.

    It is also important to note that the birds already inland do not seem to participate in this behavior. I believe it is more of a “spur of the moment” type of situation. If a bird is out on the sea, they have the choice to exert themselves fight the storm to get to shore, or ride the storm through.

    Although this whole situation seems outlandish, when we dive in and really think about the birds’ choices, it ends up making a lot of sense!

    Sources:

    https://www.sciencenews.org/article/seabirds-typhoons-shearwaters-survival#:~:text=Some%20seabirds%20don’t%20just,the%20National%20Academy%20of%20Sciences.

    https://www.pnas.org/doi/10.1073/pnas.2212925119

  • POV: You are a Scientist Starting Research

    Imagine you are sitting in your lab, racking your brain over what research project to start next. You’ve hit a metaphorical “researcher’s block” and can’t come up with anything.

    This might actually be you one day in your professional career, or even in undergraduate personal research projects. Conducting research can be fun and super interesting, however, the beginning stages of coming up with a topic can sometimes feel tedious and frustrating. Hopefully, the steps below will help introduce this process and assist in making starting your own research easier.

    1. Find a subject –> chemistry, psychology, biology, physics, etc. 
      1. Research Areas and Topics | NORC.org
    2. Look up topics in your subject and pinpoint what is interesting to you 
    3. Look up existing research articles in your topic area and hone in on a more specific problem/question that hasn’t been answered yet 
      1. Or add on to existing research (same study with new population, same study with extra/new independent variable, etc.) 
        1. The best academic research databases [2022 update] – Paperpile
          1. Research Databases | EBSCO
          2. JSTOR Home
    4. Decide on a concrete research question 
      1. Operationally define your variables 
        1. Operational Definition – defining variables based on how they will be measured (be specific) 
          1. (3) operational definition – YouTube
      2. Decide if it is plausible with your current time and resources 
      3. Is it ethical? 
        1. What Is Ethics in Research & Why Is It Important? – by David B. Resnik, J.D., Ph.D. (nih.gov)
    5. Find more articles pertaining to your research question 
      1. Background information relating to your population, independent and dependent variables, etc. 
    6. Revise your question, if needed, after looking at more research 
    7. Lay out your methodology 
      1. Will you need any scales (existing or creating one)? 
        1. Types of Data & the Scales of Measurement | UNSW Online
      2. How will you reach out to participants (if needed)? 
        1. Participant Recruitment for Research | Digital Healthcare Research (ahrq.gov)
        2. Will you need to go through the International Review Board (IRB) — necessary when using human participants!
          1. IRB Review Process | Research Ethics & Compliance (umich.edu)
      3. Will you need any advanced equipment? 
    8. What is your hypothesis? 
      1. Make it simple, logical, falsifiable, testable, and positive 
        1. Logical – founded in existing research; follows logical argument 
        2. Falsifiable – must be possible to find results contrary to the hypothesis 
        3. Testable – variables must be measurable/observable 
        4. Positive – must be positive in that it establishes the existence of something (such as a relationship, difference, etc.) 
  • Is that Marilyn Monroe… or Albert Einstein?!

    Look at this picture from up close and far away. What changes as you move further away from the screen?

    What’s Computer Vision anyway?

    When I hear the term “computer vision”, the first thing that comes to mind is a computer with eyes that enable it to have a sense of vision. Although this is not the exact definition the computer science industry would agree with, my train of thought is on the right path. Computer vision is a subfield of computer science that concerns itself with the problem of matching up how humans see and how computers see. I know what you’re thinking- computers can’t see! That’s precisely the issue! However, after a few weeks in CS 4476 at Georgia Tech, I have begun to learn a few things about how the scientific community has worked to solve this disconnect between machines and humans. In this reflection, I will present a brief walkthrough of my experience completing CS 4476 Project 1 and some of its important concepts with corresponding pictures. If you enjoy optical illusions, get ready for hybrid images!

    There is a common misconception among people outside of the computer science (CS) community that computers are extremely smart and adept- the reason being that computers can do difficult tasks at lightning speed while a human would likely take much longer. This is FALSE! Everything a computer “knows” how to do, it was taught how by a human. Fields like artificial intelligence and machine learning have been wondering how to reflect human cognitive functions like thinking, feeling, and perceiving onto machines. Computer vision is no different- we want to know how to make a computer see the same way a human sees.

    My experience in CS and Project details

    When I started this class this semester, I was just as intimidated as I was walking into the Machine Learning course last year. I did end up surviving that terrifying ML class although I still have nightmares about the assignments. Most CS courses at Georgia Tech are known to be intimidating to me with all of the complex math and science thrown around; computer vision was no exception. The first project, titled Convolution and Hybrid Images, required students to write an image filtering function in order to create hybrid images. What does all this mean? Allow me to explain as best I can without going into intense, scary detail.

    Our project was broken up into three parts: Image Filtering, Hybrid Images with PyTorch, and understanding input/outputs in PyTorch. The first section involved using Gaussian Kernels in order to blur the images given in the prompt: to do this, we had to implement concepts from linear algebra to create vectors and statistics to manipulate variables like mean, standard deviation, and covariance of the Gaussian. The term kernel in this context does not have anything to do with popcorn, although that was my first thought too. A kernel in computer science is the core of any operating system that provides basic functions to every other part of the system.

    the visualization of the Gaussian kernel

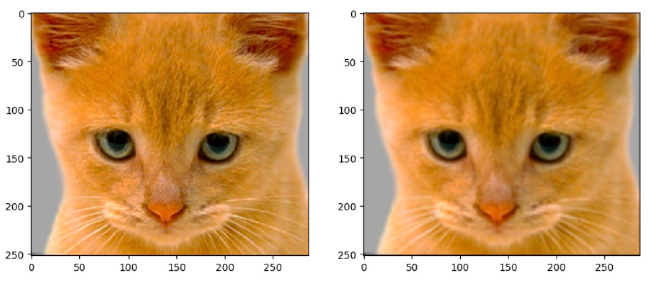
    Using the Gaussian filter, we were able to see the image filtering function we wrote in action, blurring an image of a cute cat. See how the cat on the right is ever-so-slightly blurry?

    Left-original, right-blurred

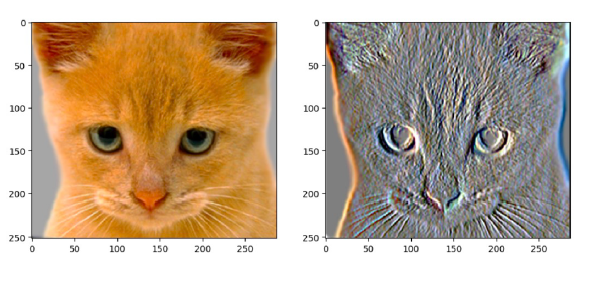
    Next, we implemented something called a Sobel Filter, which uses the Sobel operator to calculate the gradient of image intensity at each pixel. In terms of image altering, here is what happened to our cat picture after applying the Sobel Filter:

    Sobel Filter on cat image

    The real fun begins…

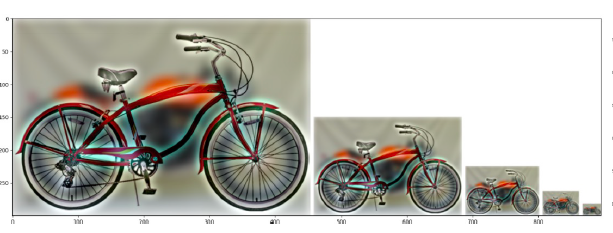
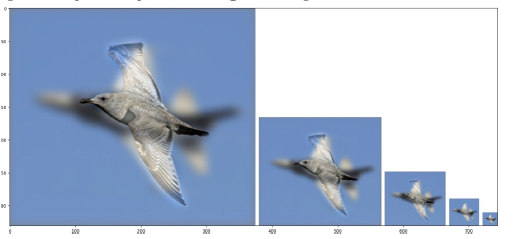
    My favorite part of this entire assignment was the hybrid image portion. A hybrid image is the combination of a low-pass filtered version of one image and a high-pass filtered version of another image. Low and high pass filtering refers to cutting out either the low or high frequencies in an image and only leaving one or the other. You might have heard about frequency in sounds, but what is frequency in an image? The frequency of an image is basically the rate of change of intensity values- if an image has high frequency, the pixels move from one pixel to the next quickly. In low frequency, the pixel’s color values share similar hues since the pixels move slowly to the next pixel. Hybrid images remind me of optical illusions because the eye sees one image from looking near the screen and sees the other image when looking from a far distance. The way that the image filtering sort of tricks the eye into seeing two different images in “one” image is one of the things that makes computer vision so cool! Some more hybrid image examples can be seen below:

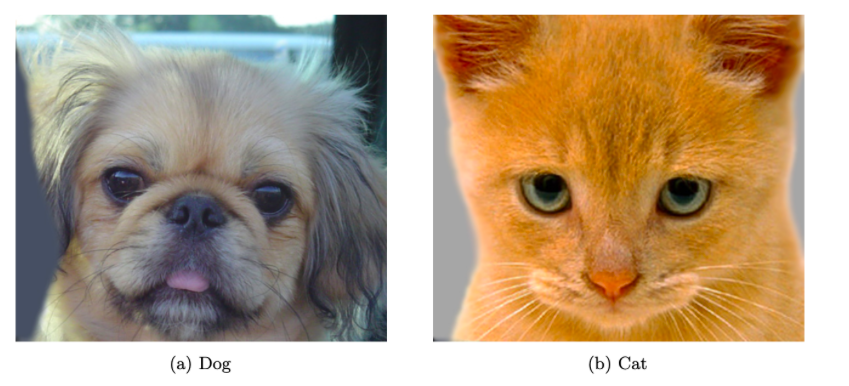
    original cat and dog images
    Cat + dog, cat from up close and dog from far away
    Motorcycle + Bicycle
    Bird + plane

    Hybrid images are created by first calculating the low frequencies of both images being used. Then we can find the high frequency of one image by subtracting its low frequency value from all the frequencies in the image. This gives us the low frequency of image 1 and the high frequency of image 2- summing these two values gives us the beautiful hybrid images seen above.

    Conclusion

    Although computer science can be daunting with its vast library of tools and functions, going through the resources bit by bit (no pun intended) and using the help of the class TAs, I was able to complete Project 1! What I learned from this project besides the actual content was that computer vision functions take a long time to run on old computers and that Piazza is one of the best tools ever utilized at Tech. Overall, I had fun making the hybrid images though it took me a while to figure out exactly how. The key to computer science is patience, asking questions, and not giving up when errors keep bombarding your terminal.

  • To Vibe or Not to Vibe

    We’ve all been there: your friends pass you the aux cord at a party and you play your favorite songs only to be met with sighs and groans or –even worse– silence. These are some bangin’ tunes that make you smile. Why do others find those same songs to be boring or “not their cup of tea?” When we like a certain song, dopamine is released into the brain and makes us feel happy or euphoric. This causes us to like a song a little more than your friends and makes you want to listen to more songs in that genre. But what causes our brain to release this chemical? Psychology may provide the answer regarding the inner machinations of the human mind. 

    Jon Lieff, MD via grok.com.au

    Our Emotions:

    Music affects us in three major ways: it serves as a nice distraction, stimulates internal curiosity, and can affect our emotional state. For example, people might listen to music to destress or have as background noise– meanwhile, other people could use those same songs to hype themselves up for a workout. These differences lead us to choosing different genres and songs.

    Music is also interpretive and allows us to choose our own meaning and significance for a certain song. This subjectivity allows different people to determine that in different ways. The same line that means nothing to you may make your friend very emotional. Take your favorite song: is there any reason why you really appreciate the song? Do you associate an emotion with the song? This may be a reason as to why there isn’t a favorite universal genre or song. Since music typically appeals to the emotions, people may associate a certain feeling with a song and grow attached to it. For instance, some of my favorite songs are those that I’ve listened to with my friends and raved about or the ones that my former piano teacher introduced me to. 

    Identity:

    In addition to personal emotions, our perceptions of others and ourselves also influences our taste in music. People have often used music as a way to express themselves and their identity. Because of that, people have associated some songs with certain archetypes of people. According to one study that asked participants to map certain traits to genres, they associate genres like pop and country were more extroverted. On the other hand, jazz and classical were thought of as more reflective.

    ResearchGate, 2016

    Culture:

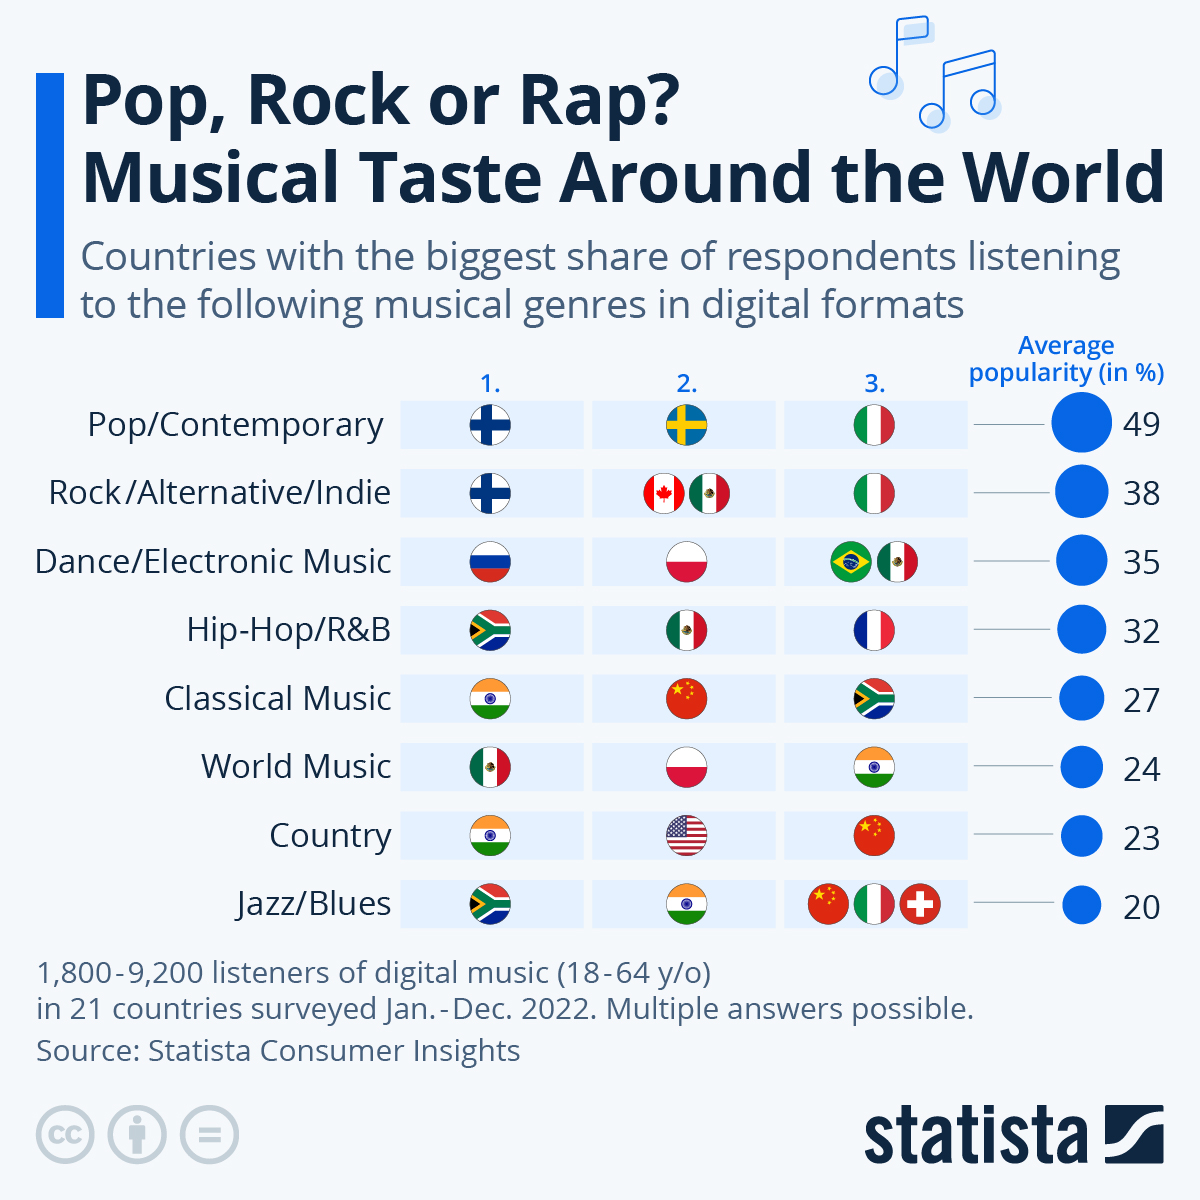
    Our preferences for certain songs may also be cultural. If we’re exposed to a lot of a certain type of music, we may lean towards more songs that contain those same elements. There are two forms of chords: consonant and dissonant. Consonant chords contain frequencies that are different enough that they don’t seem to clash. Meanwhile, dissonant chords sound a bit more chaotic for lack of better terms. Western music (like pop) usually contains a lot of consonant chords, and Americans have a strong preference for these sounds. However, some other cultures do not show that same, strong preference.

    Statistica 2021

    Whether it be because of what we were exposed to growing up or our self-identity, music tends to distinguish us from others. Although not much research has been done to see if it is truly connected to our personalities, we still manage to label people according to the music they listen to. Perhaps the real question is if the songs we vibe to influences if people vibe with us.

    Resources:

    Anne Trafton, Anne. “Why We like the Music We Do.” MIT News | Massachusetts Institute of Technology, Massachusetts Institute of Technology, 13 July 2016, https://news.mit.edu/2016/music-tastes-cultural-not-hardwired-brain-0713.

    Chamorro-Premuzic, TomasPsychology. “The Psychology of Musical Preferences | Psychology Today.” Psychology Today, 14 Jan. 2011, https://www.psychologytoday.com/us/blog/mr-personality/201101/the-psychology-musical-preferences.

    Clark, Katelyn, et al. “Why Do We like (or Dislike) Certain Music?” Grok, 30 Jan. 2021, https://grokonline.com.au/2021/01/31/why-do-we-like-or-dislike-certain-music/.

  • Music & Emotions: A Series (Part 3 – Indignant/Defiant)

    Album Songs:

    1. You’ve Seen the Butcher – Deftones
    2. Links 2 3 4 – Rammstein
    3. Psychosocial – Slipknot
    4. I Stand Alone – Godsmack
    5. Ride the Lightning – Metallica
    6. The Last Ten Seconds of Life – The Face
    7. Smells Like Teen Spirit – Nirvana
    8. Duality – Slipknot
    9. Walk – Pantera
    10. Dark Entries – Bauhaus


    Welcome to Music and Emotions: A Series (Part 3)! In this part, we continue our series with the category of “Indignant/Defiant.” For a quick recap, an interesting study conducted by professors at the University of California Berkeley was conducted on how music evokes different emotions (Cowen et al., 2020). They decided upon 13 categorizations of music, one of which was “indignant/defiant.”  They found that the way that individuals classified music based on emotions was relatively similar. All of the songs included in the above album were utilized in this study and were some of the songs that participants most frequently categorized as “indignant/defiant.”


    Here, it was found that music that typically landed in this category was characterized by a “growl-like timbre” (Cowen et al., 2020). This is something often seen in music that is perceived as aggressive. In addition, there is an interesting, brief, mention of the potential connection between the threatening vocal expressions used in these songs and that of various animal species. For example, the growl of the black jaguar. This could be why there is a clear male bias in the song choices in the album since males tend to have deeper voices which are more likely to mimic the growl of an animal.

    Conversely, some examples of female-centric songs that could also fall into this category could be Shitlist by L7, Rebel Girl by Bikini Kill, and Ignorance by Paramore.


    As mentioned previously, they decided upon 13 categories and even included an interactive audio map where you can go in and see all of the songs used and see how you match up. Stay tuned for more of this series… 3 categories down, 10 more to go! Which other category would you want to hear about? Comment below any songs you may think hit the mark for the “Indignant/defiant” category and how you matched up to others in the interactive audio map! 


    Bibliography:

    Cowen, A. S., Fang, X., Sauter, D., & Keltner, D. (2020). What music makes us feel: At least 13 dimensions organize subjective experiences associated with music across different cultures. Proceedings of the National Academy of Sciences, 117(4), 1924–1934. https://doi.org/10.1073/pnas.1910704117 

  • Music & Emotions: A Series (Part 2 – Amusing)

    Album Songs:

    1. The Streetbeater (Sanford and Son Theme) – Quincy Jones
    2. Grass Land – Super Mario Bros. 3 (Koji Kondo)
    3. Sugar Zone – Silent Partner
    4. Frolic (Curb Your Enthusiasm Theme) – Luciano Michelini
    5. The Good Egg (Warner Bros Cartoons) – The Carl Stalling Project
    6. Benny Hill Theme – James Rich, Randolph Boots, Leslie Mark Hill
    7. I Write Sins Not Tragedies – Panic! At The Disco
    8. Jockey Full of Bourbon – Joe Bonamassa
    9. Issues – Julia Michaels
    10. Love and Happiness – AI Green


    Welcome to Music and Emotions: A Series (Part 2)! In this part, we continue our series with the category of “Amusing.” For a quick recap, an interesting study conducted by professors at the University of California Berkeley was conducted on how music evokes different emotions (Cowen et al., 2020). They decided upon 13 categorizations of music, one of which was “amusing.” Within this study, the researchers had participants from the US and China listen to over 2,000 music samples and report the specific feeling they felt (“angry, “dreamy,” etc.) as well as the broad affective features they noticed (valence, arousal, etc.). This allowed them to create a pool of data which they analyzed with large-scale statistical tools in order to identify 13 distinct types of subjective experiences attached to music among both cultures (Cowen et al., 2020). All of the songs included in the above album were utilized in this study and were some of the songs that participants most frequently categorized as “amusing.”


    In this study, it was found that emotions such as “amusement” and “triumph” were among those that were better translated cross-culturally. They tested both American as well as Chinese individuals which led them to this conclusion. It was also suggested that the categories dealing with subjective experiences, including “amusement,” may be more directly related to the music itself, meaning that certain features may be analyzed in a more culture-specific way among these (Cowen et al., 2020).


    As mentioned previously, they decided upon 13 categories and even included an interactive audio map where you can go in and see all of the songs used and see how you match up. Here you can also toggle through the USA and China participants to see the cross-cultural translation of music and emotions.  Stay tuned for the next part of this series where I will create an album on the “Indignant/Defiant” category! Comment below any songs you may think hit the mark for the “Amusing” category and how you matched up to others in the interactive audio map!


    Bibliography:

    Cowen, A. S., Fang, X., Sauter, D., & Keltner, D. (2020). What music makes us feel: At least 13 dimensions organize subjective experiences associated with music across different cultures. Proceedings of the National Academy of Sciences, 117(4), 1924–1934. https://doi.org/10.1073/pnas.1910704117 

  • Racing Rats’ Impact on Mental Health

    A cartoon rat examines a rodent operated vehicle.Introduction

    The authors of “Enriched environment exposure accelerates rodent driving skills”, published in Behavioral Brain Research, conducted an experiment intended to study the impact of the environment on the efficacy of stress-releasing mental health treatments in lab rats. This study aimed to see how an enriched environment, both socially and intellectually, promotes stress relief while doing fun activities. The process for teaching the rats to drive the rodent operated vehicles (known as ROVs) also has implications for the importance of enrichment in how service dogs are trained.

    Study Summary

    There were two groups of rats that participated in this study. The control group of rats lived in a standard environment for laboratory rats, in standard laboratory cages, each with one other rat. The experimental group of rats lived in housing with an enriched environment. These rats got multiple rat friends, rat toys to keep them occupied, and multi-level housing.

    The study began with a “training period”, where rats in both groups were taught by operant conditioning how to drive the ROVs. While the authors of the study expected the rats living in standard housing to perform worse than the other rats, they were shocked at how much worse they performed. The authors noted that the control group rats failed to perform even “basic” tasks in driving the ROVs.

    After the training period (in which food rewards were used to encourage the rats to drive), both groups of rats continued to drive the ROVs even in the absence of rewards. However, rats living in enriched housing drove the ROVs without treats for a longer period of time than the rats living in standard housing. Throughout the study, the scientists measured the levels of hormones that were indicative of the rats’ ability to handle stress. Both groups showed an improved ability to handle stress as a result of ROV driving, but the enriched housing rats showed a significantly larger benefit than the standard housed rats.

    Conclusion

    This investigation shows that the environment of an animal has a significant impact on the effect of stress relieving interventions. The authors suspect that the enriched rats were more able to learn new behaviors (driving the ROVs) as a result of experiencing a wider variety of behaviors in their enriched home environments. The results of this study have interesting ramifications on the optimal conditions for other animals who will be undergoing rigorous training. Additionally, this study demonstrates how a good environment that has opportunities for social connection and mental challenges is beneficial in mental health treatment.

    References

    Crawford, L. E., Knouse, L. E., Kent, M., Vavra, D., Harding, O., LeServe, D., Fox, N., Hu, X., Li, P., Glory, C., & Lambert, K. G. (2020). Enriched environment exposure accelerates rodent driving skills. Behavioural Brain Research, 378, 112309. https://doi.org/10.1016/j.bbr.2019.112309

  • Music & Emotions: A Series (Part 1 – Scary/Fear)

    Album Songs:

    1. Flow – Peder B. Helland
    2. FSO – Jaws “The Shark Theme” – John Williams
    3. Halloween 1978 (main theme) – John Carpenter
    4. The Murder – Bernard Herrmann
    5. Crawling – Linkin Park
    6. Toccata in D Minor – Bach (1709)
    7. The End (It’s Near) – Noctilucant
    8. Pier to Nowhere – Charlie Spring
    9. Emperor’s New Clothes – Panic! At The Disco
    10.  Piano Concerto 1 in B Flat Minor – Tchaikovsky


    Welcome to Music and Emotions: A Series (Part 1)! This series will be delving into an interesting study conducted by professors at the University of California Berkeley in which they investigated how music evokes different emotions (Cowen et al., 2020). They decided upon 13 categorizations of music, one of which was “scary/fearful.” They found that the way that individuals classified music based on emotions was relatively similar, even cross-culturally. All of the songs included in the above album were utilized in this study and were some of the songs that participants most frequently categorized as “scary/fearful.”

    According to the research, “scary/fearful” typically incorporates harmonic dissonance (Cowen et al., 2020). This emphasizes how some of the emotions people experience may have associations to specific melodic/harmonic intervals. For instance, the Herrmann piece included above is the soundtrack from the famous shower scene in Psycho! Here you can see a clear example of the tension and fear that arises from the use of harmonic dissonance. If you want to see a more in depth explanation of the genius music theory behind Herrmann’s song, here is a link to a very interesting analysis on YouTube.

    As mentioned previously, they decided upon 13 categories and even included an interactive audio map where you can go in and see all of the songs used and see how you match up. Stay tuned for the next part of this series where I will create an album on the “Amusing” category! Comment below any songs you may think hit the mark for the “Scary/fear” category and how you matched up to others in the interactive audio map!


    Bibliography:

    Cowen, A. S., Fang, X., Sauter, D., & Keltner, D. (2020). What music makes us feel: At least 13 dimensions organize subjective experiences associated with music across different cultures. Proceedings of the National Academy of Sciences, 117(4), 1924–1934. https://doi.org/10.1073/pnas.1910704117